GEX Heatmap Explained: Reading Dealer Gamma by Strike
A GEX heatmap maps gamma exposure across time and strike. Read the signed call/put-wall and |GEX| intensity views, and trade walls as they build and drain.
A single GEX snapshot tells you where the call walls and put walls sit right now. A GEX heatmap tells you something more useful for timing a trade: how that dealer-gamma structure is building, draining and migrating over time — and exactly where price is sitting inside it. Instead of one column of numbers, you get a full map: time across the bottom, strike up the side, colour for the gamma at each strike, with the spot price line threaded on top.
If you have read the GEX pillar guide, you already know the mechanism — dealers hedge gamma, positive gamma pins and negative gamma trends, walls bracket the range. This article is the focused companion on how to actually read the heatmap view and turn it into entries, stops and targets.
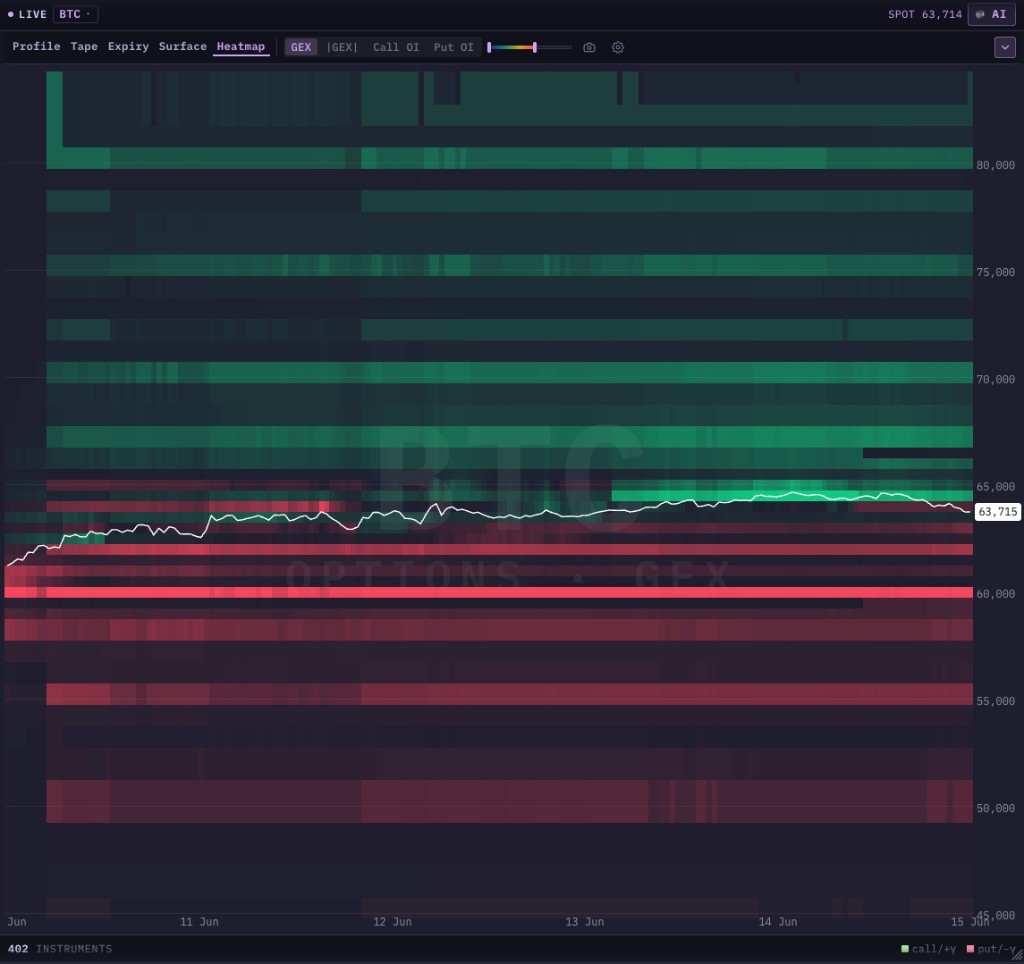 The signed GEX heatmap: green bands are positive-gamma (call-wall) strikes, red bands are negative-gamma (put-wall) strikes, and the white line is spot. Where the price line travels relative to the bands — and which bands brighten or fade — is the whole read.
New to gamma exposure? Start with What Is GEX? Gamma Exposure Explained for Traders for the dealer-hedging mechanism, the two regimes, and the gamma flip / max pain / wall definitions used throughout this article.
What a GEX heatmap shows
A GEX heatmap takes the GEX-by-strike profile — the same data behind the call wall and put wall — and adds a time axis, so you watch the whole gamma structure evolve rather than reading a single moment.
- Horizontal axis = time. Each column is a time slice (the left edge is older, the right edge is now).
- Vertical axis = strike price. Same scale as the chart, so a band lines up with the price level it represents.
- Colour = gamma at that strike, in that slice. The two views below encode it two ways.
- The white line = spot price over the same window, drawn on top so you instantly see where price is relative to the gamma structure.
Reading the map is then two questions, asked together: which bands is price near, and are those bands getting brighter or fading.
The signed view: call walls vs put walls
The default view is signed — colour carries the direction of the gamma, not just its size.
- Green bands = positive gamma (call-wall side). These tend to sit above price and act as resistance and an upside magnet/cap, because dealer hedging at those strikes sells into strength.
- Red bands = negative gamma (put-wall side). These tend to sit below price and act as support, because hedging there buys into weakness.
- Brightness = concentration. A vivid band is a heavily-stocked wall; a faint one is a minor level.
Read it like a corridor: the brightest green band overhead is the ceiling the market is most likely to respect, the brightest red band underneath is the floor, and the white spot line travels between them. When price rides just under a bright green band for days, that is the call wall capping it; when it holds above a bright red band, that is the put wall supporting it.
The signed view is also where you see the regime from the pillar guide: when the white line sits inside the green (positive-gamma) structure, expect the pinning, mean-reverting behaviour; when it drops into the red (negative-gamma) structure, expect the amplified, trending behaviour.
The |GEX| intensity view: pure magnitude
Toggle to the |GEX| (absolute value) view and the sign disappears — colour now encodes how much dealer gamma sits at a strike, regardless of whether it is a call or put wall. A common palette runs cool (low) → warm → hot (high), so the brightest bands are simply the most important strikes on the board.
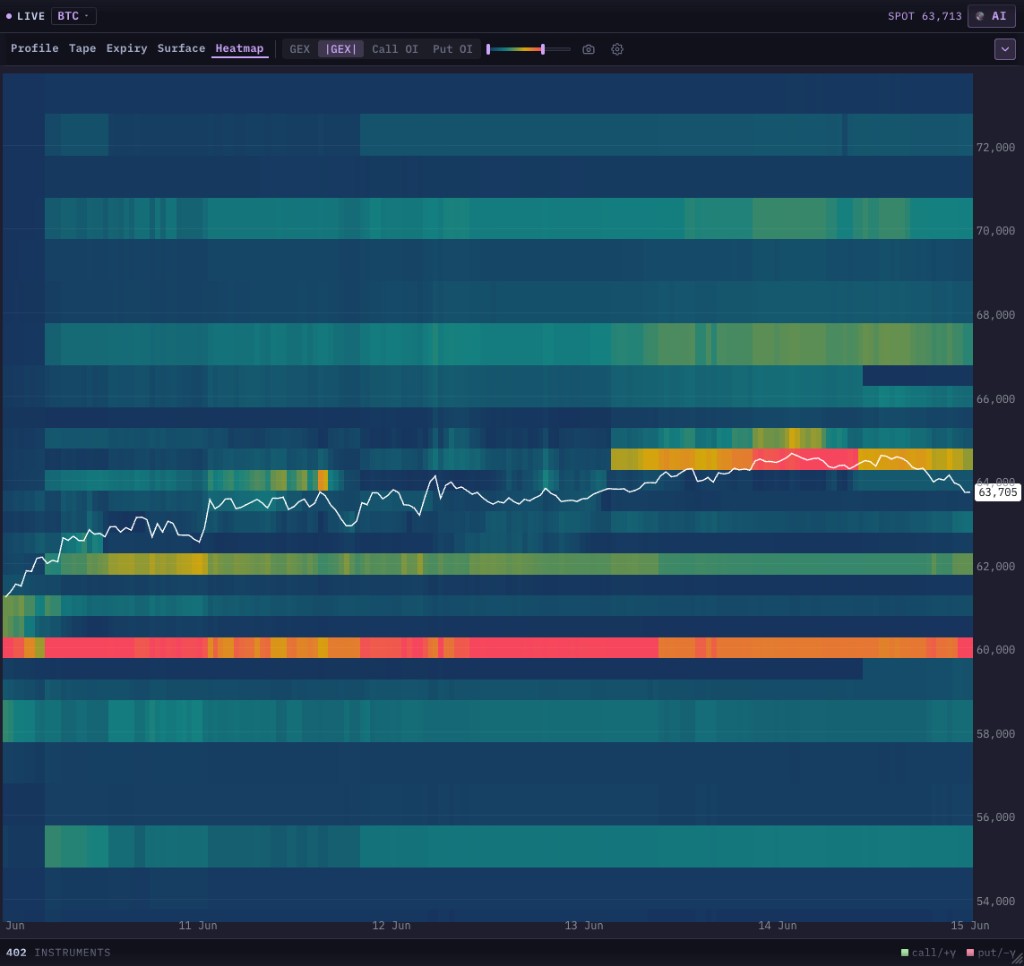 The |GEX| intensity view drops the sign and shows pure magnitude: the hottest bands are the strikes with the most dealer hedging, full stop. Use it to find the levels that matter most, then flip back to the signed view to learn which side — support or resistance — each one is.
Why have both? The intensity view is the fastest way to find the levels that matter — your eye goes straight to the hottest bands. The signed view then tells you what each level is — a ceiling (call wall) or a floor (put wall). Pros bounce between the two: intensity to locate, signed to classify.
Reading the price line against the bands
The white spot line is what turns a static heatmap into a trade. Three patterns to watch:
- Riding a band. Price grinding along the underside of a bright green band (or the top of a red one) for several columns is the wall doing its job — resistance or support holding. In a positive-gamma regime this is the high-probability pin.
- Approaching a band through empty space. When there is a dark gap between the spot line and the next bright band, there is little gamma structure in between — price can travel quickly to the band and then react there. A thin approach to a loaded wall is the cleanest setup.
- Crossing into the other colour. When the spot line drops out of the green structure into the red — or reclaims green from red — you are watching the regime change in real time. That is the heatmap version of the gamma-flip cross from the pillar guide, and it is the cue to switch from range tactics to momentum tactics (or back).
Call OI and put OI views
The same heatmap can be re-coloured by open interest instead of gamma — a Call OI map and a Put OI map. Where the gamma view shows hedging pressure, the OI view shows where the contracts actually live. They usually agree (big OI breeds big gamma), but when they diverge it is informative: a strike with huge OI but modest gamma is far-dated or far from the money; a strike with outsized gamma relative to its OI is near-the-money and near-expiry, which is exactly where pinning is strongest. Because every cell carries all of these, switching the view is instant — no reload, just a different read of the same map.
How to trade the GEX heatmap
The heatmap's edge over a snapshot is time — you see walls change, and change is tradeable.
- Find the loaded walls (intensity view). Identify the brightest, most persistent bands — the strikes the whole board is built around.
- Classify them (signed view). Green overhead = the ceiling; red underneath = the floor. Note the gamma-flip boundary between the two colours.
- Locate price. Is the spot line inside the green (pin/range regime) or in the red (trend regime)? Is it riding a wall, or approaching one through a dark gap?
- Trade the regime, into the wall. In positive gamma, fade toward the centre and treat the bright walls as range edges. In negative gamma, respect that a wall breaking is more likely to extend than reverse.
- Watch walls build and drain. A band that suddenly brightens is fresh resistance/support arriving — a reason to expect a stall. A band that fades is a wall draining; the level it was defending becomes vulnerable, and a long pin can resolve into a fast move once its cap is gone. A draining wall ahead of price is one of the most actionable things the heatmap shows that a snapshot cannot.
As always, the heatmap supplies bias and levels; your entry trigger and invalidation still come from price and structure. The walls tell you where to plan; the regime tells you whether to fade them or trade through them.
Crypto and multi-asset
The GEX heatmap is computed for the assets with deep enough options markets to form real dealer gamma: crypto (BTC, ETH), gold, and major US index ETFs. Crypto is especially clean on the heatmap because it trades 24/7 — the spot line keeps moving against the gamma bands around the clock, so the approach-to-a-wall and ride-a-wall reads play out continuously, even while the underlying options positioning (which only updates as new contracts trade) changes more slowly. On non-crypto underlyings the strike bands are mapped onto whatever instrument you chart so they line up with your price scale.
Common mistakes
Trusting a wall without checking the sign. On the intensity view every hot band looks equally important, but a call wall (resistance) and a put wall (support) behave oppositely. Always flip to the signed view before you act.
Reading a single column. The point of the heatmap is the time axis. A band that exists for one slice and vanishes is noise; a band that holds across many columns is structure. Judge persistence, not a single moment.
Ignoring drain and build. A wall is not permanent. Treating last week's bright band as today's hard level — when it has since faded — is how you get run over. Re-read the right edge of the map; it is the only column that is now.
Forgetting the regime. A bright green call wall is resistance in positive gamma. If the spot line has already dropped into the red, that same band can be sliced through by amplifying flow. The colour of the structure price sits in always comes first.
Confusing it with the orderbook or liquidation heatmap. This map is options-dealer gamma. It is a different lens from the orderbook heatmap (resting limit orders) and the liquidation heatmap (forced leverage flow). Stack them; don't substitute one for another.
Where to go from here
- What Is GEX? Gamma Exposure Explained for Traders — the pillar: the dealer-hedging mechanism, the two regimes, gamma flip, max pain and walls in full.
- GEX Indicator — Trading Options Gamma Levels on Your Chart — the overlay companion: drop the walls you see building here straight onto your candles, with a live regime read.
- How to Read an Orderbook Heatmap for Trading — the resting-liquidity heatmap that complements GEX positioning.
- Liquidation Heatmap + RSI: Trading Long-Term Trend Waves — forced-flow fuel, which pairs powerfully with a negative-gamma regime.
See it move for yourself: create a free mrD account, open the chart terminal, add the Options GEX panel on BTC or ETH, and switch to the Heatmap tab to watch the walls build and drain in real time.
This article is education, not financial advice. The GEX heatmap is a model-based estimate of dealer positioning, not a record of real orders. Trading involves risk; never risk capital you cannot afford to lose.