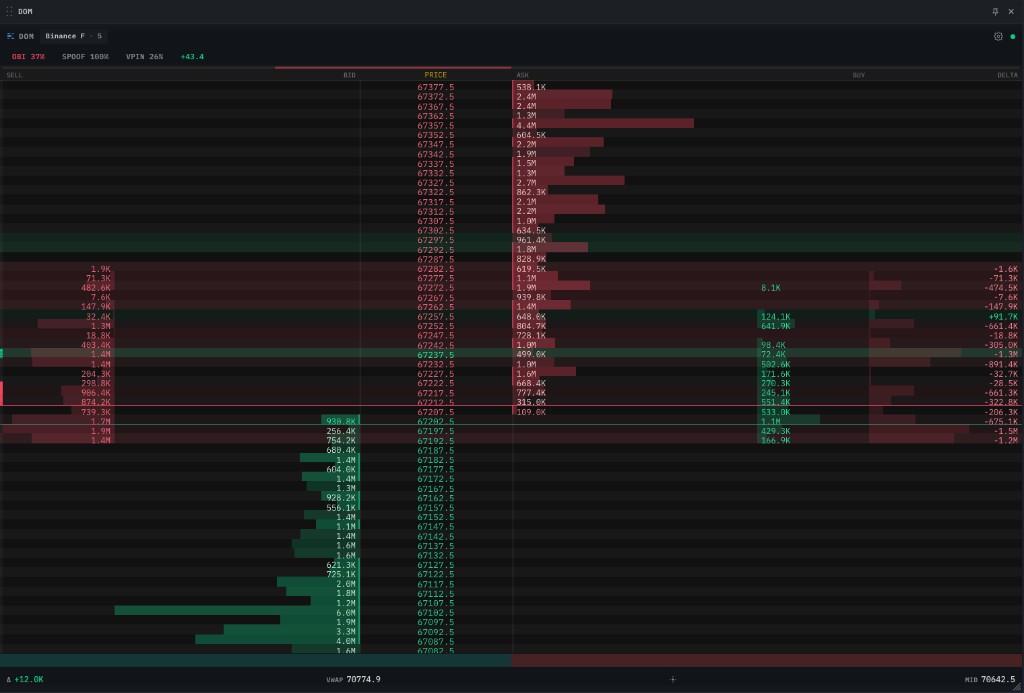
How to Read the DOM Ladder: An Order-Flow Trading Guide
The DOM ladder (depth of market) shows resting bid/ask size, aggressive buy and sell volume, and per-level delta live. Learn to read walls and absorption.
Jun 3, 2026 · 13 min read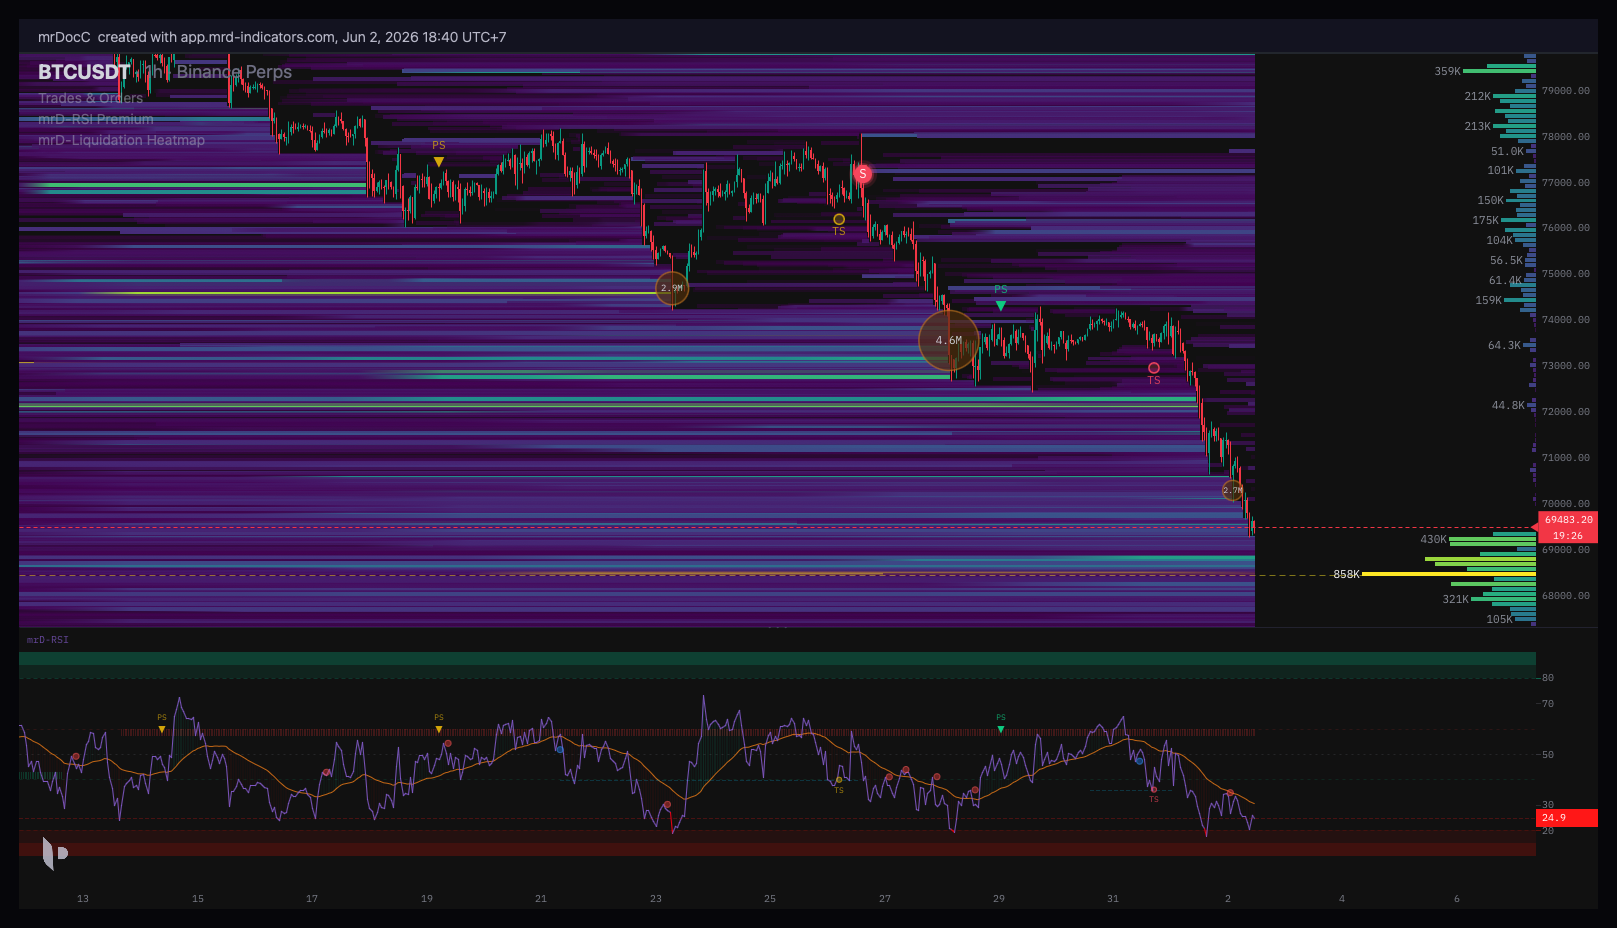
Liquidation Heatmap + RSI: Trading Long-Term Trend Waves
Combine the liquidation heatmap with RSI to ride long-term trend waves: forced-deleveraging mechanics, an RSI regime filter, and a swing framework across 500+ Binance altcoin pairs.
Jun 2, 2026 · 16 min read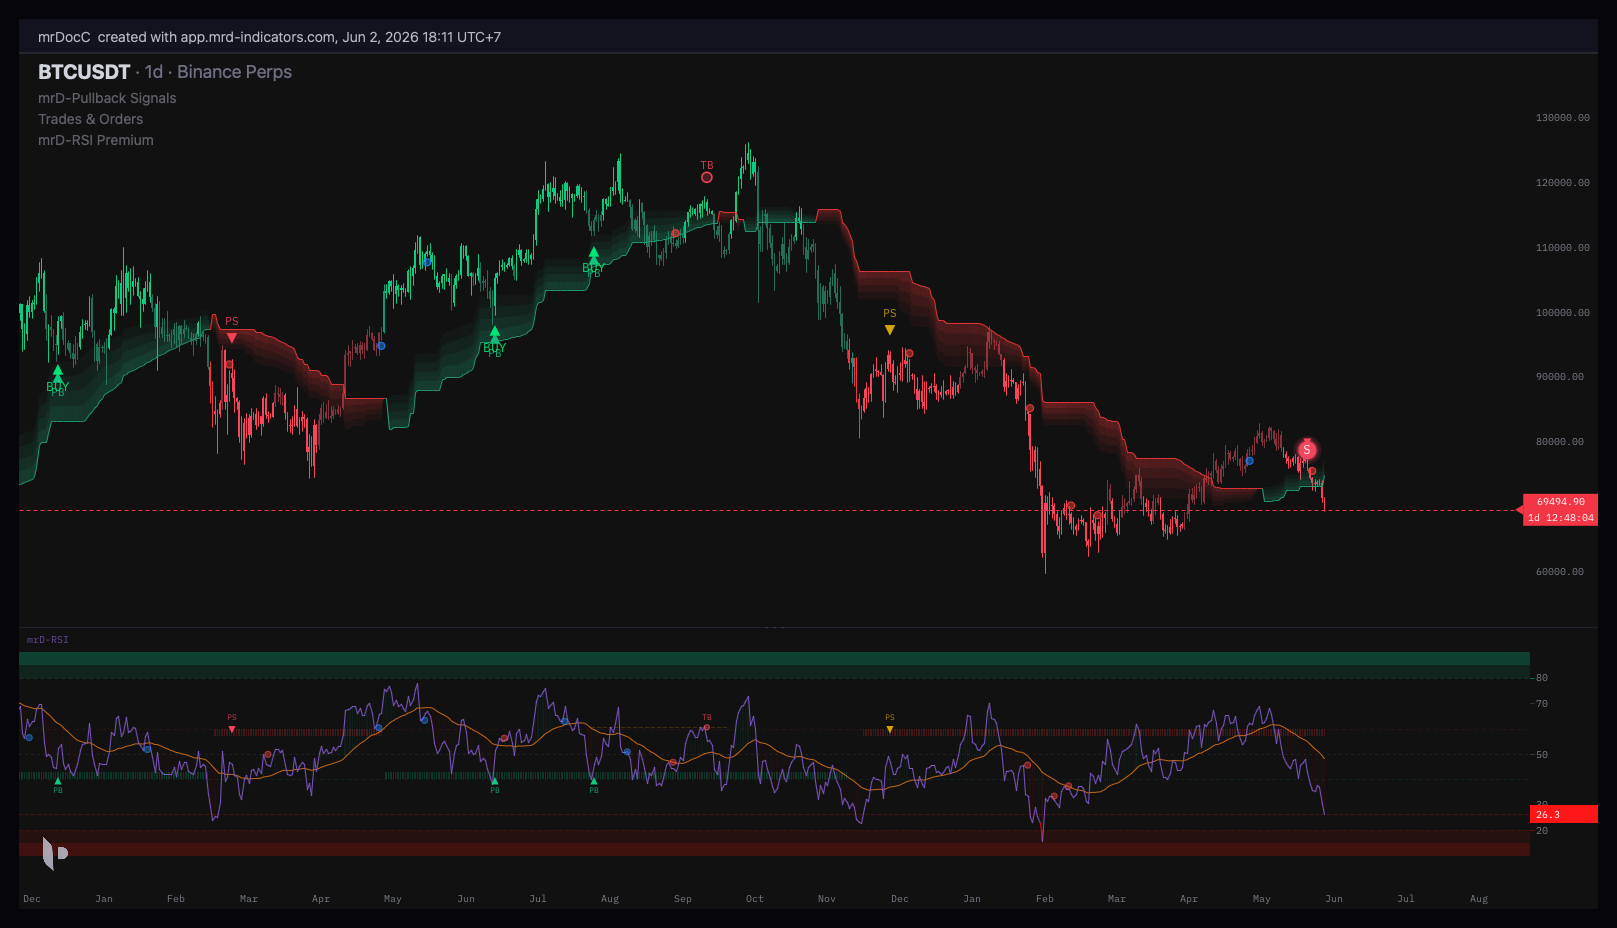
RSI as a Momentum Instrument: Value and Structure
What RSI really measures: momentum, not overbought/oversold. RSI momentum value (Cardwell range rules), structure (Baeyens), and why momentum leads price.
May 31, 2026 · 28 min read
Trading with CVD Profile: A Practical Guide
How to read a CVD Profile and trade four repeatable setups — trapped traders, distribution top, accumulation bottom, and absorption resolution — with clear entry rules.
May 24, 2026 · 12 min read
Trading Chart with Depth Heatmap: Complete Guide [2026]
Learn how a trading chart with depth heatmap visualises real-time orderbook liquidity behind candlesticks. Patterns to read, tools that support it, and a 50-line JavaScript implementation.
May 15, 2026 · 12 min read
How to Read an Orderbook Heatmap for Trading: 5 Patterns That Print Money
Five orderbook heatmap patterns every trader should recognise on sight: resting walls, spoofing flashes, iceberg refresh, liquidity vacuums, and stacked accumulation. With real BTC/USDT examples.
May 12, 2026 · 10 min read
Choosing an Orderbook Heatmap Chart Library: A Practical Buyer's Guide for 2026
A practical buyer's guide for picking a JavaScript orderbook heatmap chart library. The technical requirements that actually matter, the questions to ask, the build-it-yourself cost estimate, and a checklist you can run on any candidate.
May 10, 2026 · 11 min readWhat Is a Footprint Chart? The Complete Guide for 2026
A footprint chart shows trade volume at every price inside a candle — bid vs ask, delta, and POC. The complete beginner's guide with the three display modes, how aggressor classification works, and how to start reading order flow.
May 8, 2026 · 10 min read
How to Read a Footprint Chart: 8 Patterns Every Trader Must Know
Learn how to read a footprint chart in practice. Eight order-flow patterns — absorption, stacked imbalance, delta divergence, exhaustion, unfinished auction, HVN, POC rotation, and supportive-vs-fading delta — with examples and trader interpretation.
May 6, 2026 · 13 min readStacked Imbalances on a Footprint Chart: Setup, Reading, and Trading
Stacked imbalances are the most-watched footprint signal. Learn the diagonal vs horizontal detection methods, how to calibrate ratio and min rows, what bullish and bearish stacks mean, and how traders use them in practice.
May 4, 2026 · 11 min readFootprint Chart vs Candlestick Chart: Why You Need Both
A head-to-head comparison of footprint and candlestick charts. What each one shows, what each one hides, the data each requires, and how to combine them in one workflow. With concrete examples of when the footprint changes your read.
May 2, 2026 · 10 min readStart Trading Now
Don't wait for the next post — jump into the platform and explore the tools yourself.
Create Free Account