GEX Indicator: Trading Options Gamma Levels on Your Chart
A GEX indicator draws dealer gamma levels — gamma flip, max pain, call and put walls — straight onto your candles, with a live regime read. How to read and trade the overlay.
Most options-positioning tools live in a separate window: a chain, a table, a standalone dashboard you flip to and then mentally transpose onto your chart. A GEX indicator removes that step. It takes the dealer gamma-exposure read — the gamma flip, max pain, the call wall and put wall — and draws it straight onto your candles, with a small panel that tells you, in plain language, whether the market is set up to pin or to run.
The value is context. A call wall is just a number in a table; a call wall drawn as a line your price is grinding into is a tradeable level. This guide is the focused companion on the overlay — what each level on the chart means, how to read the floating regime box, and how to turn the whole thing into entries, stops and targets.
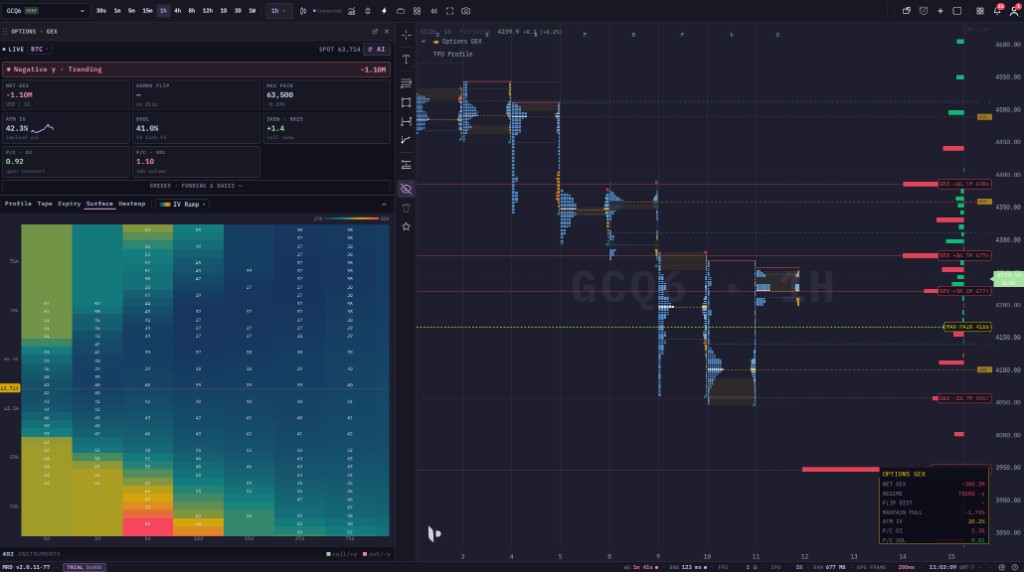 The GEX indicator in context: the key dealer-positioning levels are drawn as labelled lines on the chart, and the floating OPTIONS GEX box reads the regime — net GEX, the gamma-flip distance, the max-pain pull, ATM IV and put/call ratios — without leaving your candles.
New to gamma exposure? Read the pillar first — What Is GEX? Gamma Exposure Explained for Traders — for the dealer-hedging mechanism and the definitions (gamma flip, max pain, walls, the two regimes) this article puts on the chart. For the time-and-strike view, see GEX Heatmap Explained.
What is a GEX indicator?
A GEX indicator is the chart-overlay form of gamma exposure. Where a standalone GEX panel shows the options board in its own pane, the indicator projects the conclusions of that board — a handful of levels and a regime label — onto the price chart you are already watching.
That distinction matters in practice:
- The panel is for studying the board: the full GEX / OI / VEX / CEX profiles, every strike, the aggregate Greeks.
- The indicator overlay is for trading: the two or three levels that actually move the tape, sitting on your candles where you can plan around them, plus a one-glance regime read.
Most traders use both — the panel to understand the structure, the overlay to act on it. This article is about the overlay.
The levels it draws on your chart
The overlay marks the dealer-positioning levels as labelled horizontal lines, each with a right-edge tag so you can read it at a glance:
γ FLIP— the gamma flip. The zero-gamma regime pivot. Above it the market is usually positive-gamma (pinning, mean-reverting); below it, negative-gamma (trending, amplifying). This is the single most important line on the chart, because it tells you which playbook the price action is in.MAX PAIN— the expiry magnet. The strike where the most options expire worthless. In a positive-gamma regime it tends to pull price into expiry; in negative gamma it is easily overrun. Read it together with the regime, never alone.GEX +…/GEX −…— the gamma walls. The strikes with the heaviest gamma, labelled with their signed magnitude. The biggest positive (call) wall above price is resistance / an upside cap; the biggest negative (put) wall below is support. Together they bracket the range the market is most likely to respect while positioning holds.CALL OI/PUT OI— open-interest levels. Where the contracts actually live, as opposed to where the hedging pressure is strongest. Usually they agree with the walls; when they diverge it flags a far-dated or far-from-money strike.
You do not have to show all of them at once. Click any strike in the GEX or OI profile and that single level drops onto your chart as a labelled line — so you keep only the handful you care about, and the rest stays in the panel.
The regime read: the OPTIONS GEX box
The floating OPTIONS GEX box is the indicator's summary — the part you read first, before you look at any level. Each row:
NET GEX— the signed aggregate. Positive (e.g.+300.3M) means the pinning, vol-suppressing regime; negative (e.g.−300.3M) means the trending, vol-amplifying regime. This is the headline.REGIME— the same idea in plain language, e.g. Negative γ · Trending or Positive γ · Ranging. It is the one-line answer to "fade or chase today?".FLIP DIST— how far price sits from the gamma flip, as a percent. A small number means you are near the regime boundary — the most unstable place to be, where the character of the tape can switch on a small move. A large number means the current regime is well established.MAXPAIN PULL— the percent gap from price to max pain, i.e. the strength and direction of the expiry magnet. A−1.7%reads as "max pain sits 1.7% below — a downward drift bias into expiry," strongest in a positive-gamma regime.ATM IV— at-the-money implied volatility, the market's expected movement. Context for how wide the walls really are.P/C OIandP/C VOL— put/call ratios on open interest and on volume. They tell you whether the crowd is positioned and trading more puts or calls — a sentiment overlay on top of the gamma read.
The discipline is to read top-down: NET GEX and REGIME decide your playbook, FLIP DIST tells you how stable that playbook is, and the levels on the chart are where you execute it.
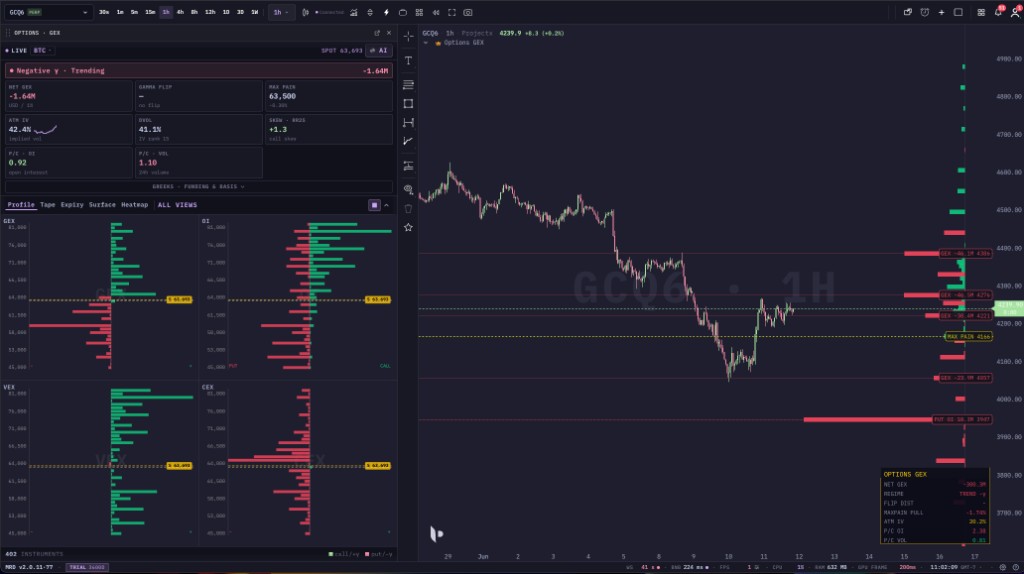 The overlay and the panel together: the panel breaks GEX down by strike, the overlay drops the levels that matter onto the candles, and the OPTIONS GEX box reads the regime so the whole positioning picture lives on one screen.
Click a level onto your chart
The overlay is interactive. Tap any bar in the GEX or open-interest profile and that strike is drawn as a labelled line on your price chart — so you curate exactly the levels you trade around rather than cluttering the chart with the whole chain.
One safeguard worth knowing: a level is only dropped when your chart is on the same asset as the selected board. A BTC gamma level will not land on an ETH chart. That keeps a positioning level from ever appearing on the wrong market — a small detail that saves a real mistake.
One-tap AI read
There is also a one-tap AI read for when you want a fast orientation. It reads the current board and writes a short, trader-readable note — the regime, the bias, support and resistance, the gamma flip, max pain, and a near-term lean — then draws the key levels onto your chart for you, one by one, so you end with the same labelled lines you would have placed by hand.
Two things to keep in mind: the levels come straight from the live board (no invented numbers), and the AI note is context, not a signal — your entry trigger and invalidation still come from price and structure.
The GEX indicator across assets
The overlay runs on every market with a deep enough options chain to form real dealer gamma: crypto (BTC, ETH), gold, and major US index ETFs. Whatever instrument you chart, the levels are mapped onto its price scale so they line up with your candles — you do not do any conversion by hand.
Crypto is especially natural for the overlay because it trades 24/7: the candles keep moving against the gamma levels around the clock, so a grind into a call wall or a hold above a put wall plays out continuously, even while the underlying options positioning (which only changes as new contracts trade) updates more slowly.
How to trade with the GEX indicator
The indicator does not fire buy/sell signals. It supplies the regime (which playbook) and the levels (where to act); your trigger comes from the chart.
- Read the box first.
NET GEX/REGIME→ are you fading (positive gamma) or chasing (negative gamma) today? - Check
FLIP DIST. Near zero means you are at the regime boundary — size down or wait. A clear distance means the regime is stable and the levels are more reliable. - Trade into the walls in the regime's direction. In positive gamma, fade extremes toward the centre and treat the call wall as resistance, the put wall as support. In negative gamma, respect that a wall breaking is more likely to extend than to reverse.
- Use
γ FLIPas your regime stop. A decisive cross of the gamma flip against your thesis is a regime-failure exit, not just a level — the whole pin-vs-trend assumption has changed. - Add
MAXPAIN PULLas an expiry bias. Approaching expiry in a positive-gamma regime, lean with the max-pain drift. Drop it in negative gamma. - Confirm with your usual read. A gamma wall that coincides with a structural level you already respected, or with resting liquidity on the orderbook, is far stronger than the gamma level alone.
Common mistakes
Trading the walls without reading the box. A call wall is resistance in positive gamma. If NET GEX is negative, the same wall can be sliced straight through by amplifying flow. The regime always comes before the level.
Cluttering the chart with every strike. The overlay is most useful with the two or three levels that matter — the flip, the nearest call and put walls, max pain. Dropping the whole chain back onto the candles defeats the point. Keep it clean.
Treating positioning as permanent. The levels come from current open interest. Around a large expiry or a big repositioning, they shift — sometimes a lot. Re-read the box and refresh the levels; do not anchor to yesterday's wall.
Reading max pain in isolation. MAXPAIN PULL is a real bias only when the regime supports it. In negative gamma it is routinely overrun. Pair it with NET GEX.
Confusing the overlay with order flow. GEX levels are options-dealer positioning. They are a different lens from the orderbook heatmap (resting limit orders) and the liquidation heatmap (forced leverage flow). Stack them; do not substitute one for another.
Where to go from here
- What Is GEX? Gamma Exposure Explained for Traders — the pillar: dealer hedging, the two regimes, gamma flip, max pain and walls in full.
- GEX Heatmap Explained — Reading Dealer Gamma by Strike — the time-and-strike view, where you watch the walls in the overlay build and drain over days.
- How to Read an Orderbook Heatmap for Trading — the resting-liquidity lens that pairs with GEX positioning.
Put it on your own chart: create a free mrD account, open the chart terminal, add the Options GEX widget on BTC or ETH, and click a wall to drop it onto your candles — then watch how price reacts to the gamma flip and the walls in real time.
This article is education, not financial advice. GEX is a model-based estimate of dealer positioning, not a record of real orders. Trading involves risk; never risk capital you cannot afford to lose.