Choosing an Orderbook Heatmap Chart Library: A Practical Buyer's Guide for 2026
A practical buyer's guide for picking a JavaScript orderbook heatmap chart library. The technical requirements that actually matter, the questions to ask, the build-it-yourself cost estimate, and a checklist you can run on any candidate.
If you have searched "orderbook heatmap chart library" on Google or npm, you have probably noticed something strange: dozens of articles explain what a heatmap is, but almost no library actually renders one inside a candlestick chart. The information is hard to find, the marketing claims are loud, and the technical reality only shows up after you have already invested weeks in an integration.
This guide is the buyer's checklist we wish existed when we started building. We are the team behind kline-orderbook-chart, so we are obviously not neutral — but the framework below is the one we use ourselves when evaluating any visualization library, and you can apply it to any candidate you are considering. By the end you will have a one-page rubric you can run on every contender, including ours.
We deliberately avoid naming competitors throughout. Public name-and-shame comparisons date badly, attract complaints, and tell you nothing the framework cannot tell you better. Bring your own list of candidates to the rubric; the rubric will sort them.
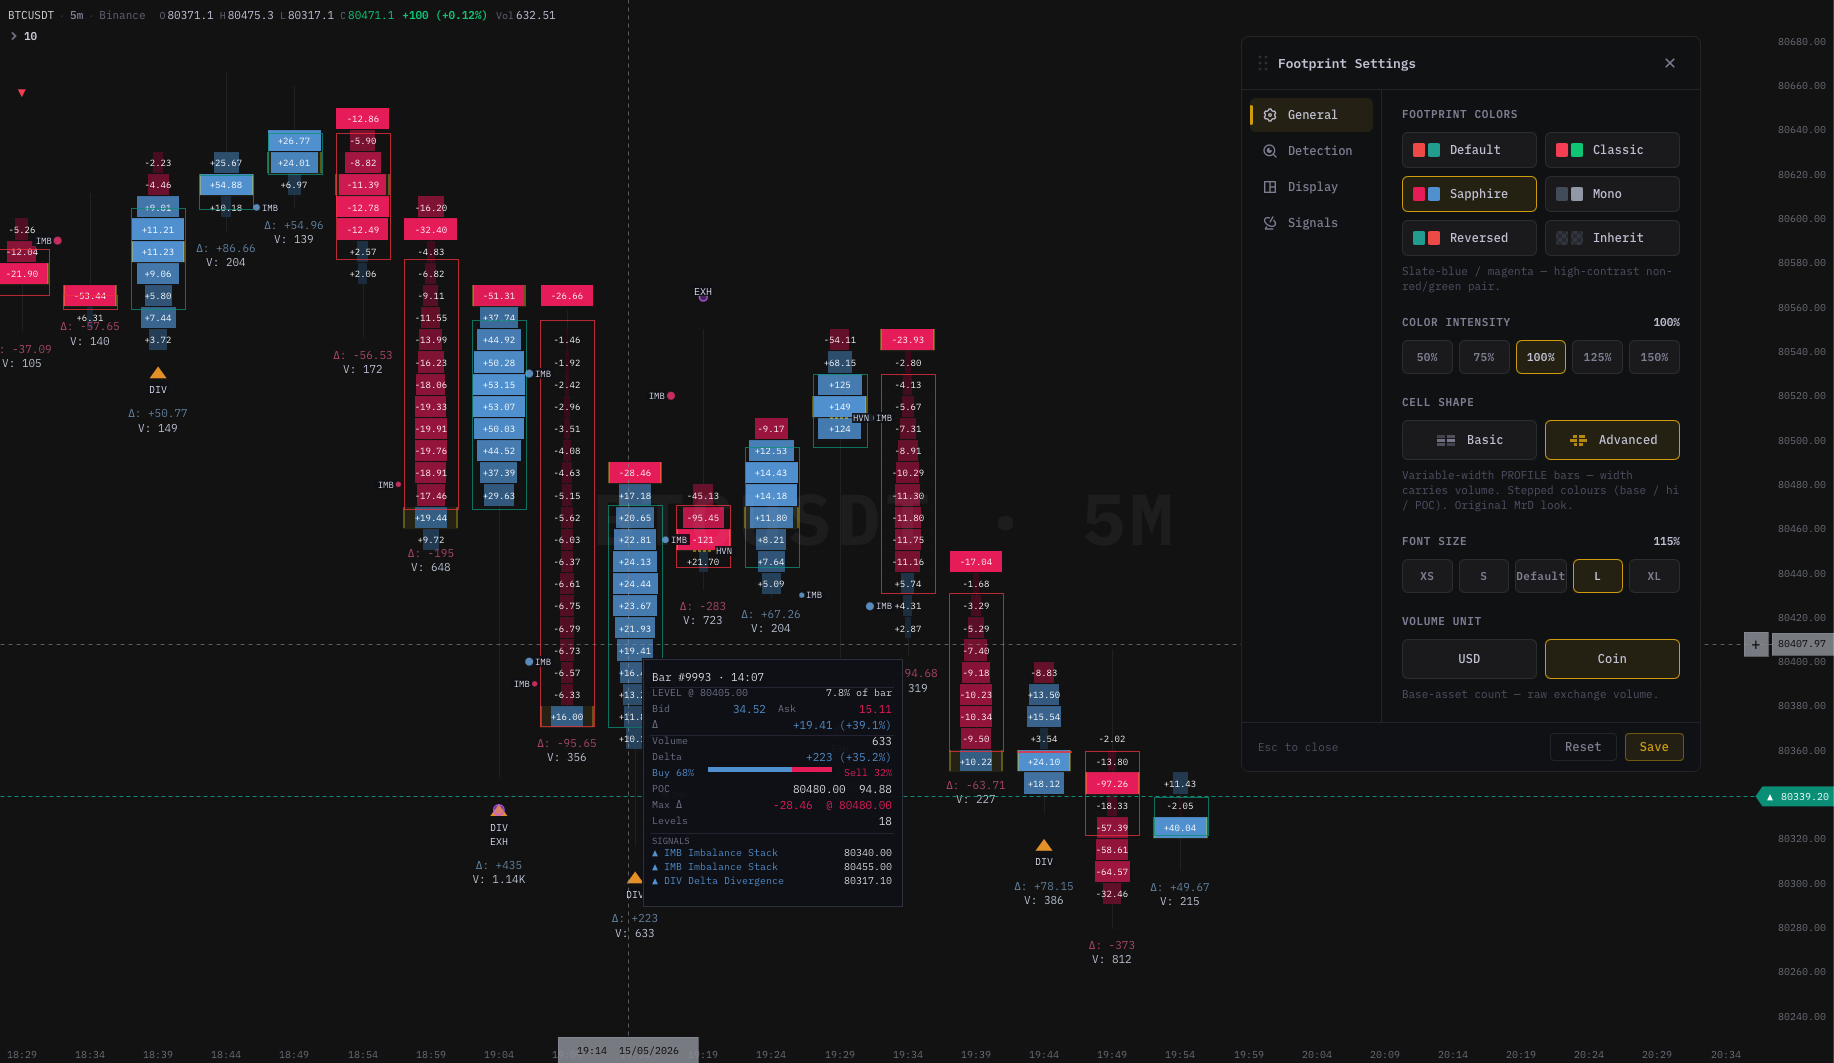
kline-orderbook-chart footprint chart — bid/ask volume at every price level, delta coloring, imbalance detection, POC highlight, and VRVP profile.
The hard requirement: depth heatmap behind candles, in one canvas
Every library on your shortlist can render candles. Many can render a heatmap. Almost none can do both in the same canvas with synchronised pan, zoom, and crosshair. That is the hard requirement, and it is the single feature that eliminates most candidates before you even read their docs.
Here is what "depth heatmap behind candles in one canvas" means concretely. If any of these conditions fails on a candidate, that library is not solving the problem you actually have:
- A single
<canvas>element. - The heatmap renders as a coloured raster occupying the price/time plane.
- Candles render on top with full transparency in their negative space (the heatmap shows through).
- Pan, zoom, scroll, crosshair, and time-axis stay synchronised between layers.
- The render loop hits 60 fps with a roughly 200×500 heatmap matrix and 1,000 candles, on a mid-2020 laptop.
If a vendor's docs only show "you can put a heatmap and a candle chart on the same page", that is a layout question, not a chart question. The two views must share one time axis, one price axis, one pan/zoom state, and one render frame, or the user experience degenerates into ghosting and lag the moment they touch the chart.
What an "orderbook heatmap" actually is
Before evaluating any library, make sure you and the vendor are talking about the same thing. The phrase "orderbook heatmap" is used loosely on the internet to mean three very different views:
- Depth heatmap — a 2D raster of resting limit-order liquidity, colour-coded by size, with time on the X axis and price on the Y axis. This is the view that matters for order-flow trading. It is the same data, animated through time, that institutional desktop tools popularised in the 2010s.
- Static depth chart — a snapshot of the current orderbook only (the cumulative bid/ask curves). Useful as a sidebar, but it has no time dimension and cannot be overlaid on candles.
- Static price-bucket heatmap — a histogram-like view where rows are price buckets and the cells colour by some metric (volume, range, etc.). Easy to build with any general-purpose heatmap series, but not an orderbook view.
When you ask a vendor "do you support orderbook heatmap?", be explicit you mean (1) — historical resting liquidity, animated over time, behind candles. Otherwise you will get a yes that means (2) or (3) and only find out three weeks into integration.
The seven technical requirements that matter
Run these seven checks on every candidate. The first three are deal-breakers; the rest are calibration.
1. Synchronised multi-layer rendering
The candle layer, the heatmap layer, and any overlay layers (drawings, indicators, footprint cells) must share one time and price axis. Pan in the candle layer should pan the heatmap at the same pixel rate, exactly. Zoom should re-bucket the heatmap matrix at the same step the candles re-aggregate. Crosshair should hit one canvas and read from all layers.
Failure mode to look for in vendor demos: the heatmap snaps to a different scale during pan, or lags by a frame. That tells you the layers are not on the same render pipeline.
2. Real-time append performance
A live chart receives orderbook snapshots and/or deltas every 100ms or so. The library must accept the new column without re-rendering the entire matrix. The cost of a single append should be O(rows being updated), not O(matrix size).
Failure mode: vendor benchmarks always show static data. Ask explicitly for a real-time append benchmark, or run one yourself with a fake WebSocket pumping data.
3. Headless / native-speed rendering, not DOM-per-cell
A typical heatmap matrix is 200 rows × 500 columns = 100,000 cells. If every cell is a DOM node or an SVG <rect>, the browser dies on the first pan. A working heatmap implementation is either:
- A canvas painted as a raster (per-cell
fillRect, orputImageDataon a typed array). - A WebGL texture uploaded once per update.
- A native-compiled routine writing directly to an
ImageDatabuffer.
Anything DOM-based collapses before it ships. If a vendor shows you a "heatmap" demo with 50 cells, it is not the same view.
4. Trade-tape support (for footprint, even if heatmap is the headline)
Heatmap shows resting liquidity. The natural companion view is the footprint chart, which shows executed aggression. Most teams that want one want the other within 12 months. If the library cannot ingest the raw trade tape and render footprint cells inline on candles, you will be replatforming once you outgrow the heatmap-only view.
Check: ask the vendor specifically about footprint cell rendering, bid×ask split inside candles, POC highlighting, and stacked-imbalance detection. If the answer is "we will roadmap it", treat it as not supported.
5. Indicator extensibility
You will need to add custom indicators. The library should expose either:
- A plugin / custom-series API where you write a function that returns per-bar values, and the library renders them.
- A scripting language (Pine-like or DSL) that ships with the product, so non-developer users can build their own.
Without either, every indicator request becomes a fork of your dependency. That ages badly.
6. License model match
Three license models exist. Pick the one that matches your business:
- Permissive open-source (Apache / MIT): zero cost, zero support, no warranty. Good for hobby, prototypes, internal tools. Risky for paid products because nobody is on the hook to fix a regression.
- Commercial per-developer / per-domain: a yearly fee, predictable, with a support SLA. Good for revenue-generating products. Cost generally scales with team size or domain count.
- Custom enterprise / OEM: bespoke deal, source-available, white-label rights, multi-year. Good when the chart is the heart of your product and you want it audited.
A library that only offers a custom enterprise deal locks small teams out. A library that only offers OSS without commercial support locks large teams out. Healthy products offer a tier ladder so you can move up as you grow.
7. Real-time data adapter, not just import-CSV
The vendor should document how the library handles a live WebSocket: backpressure when the producer is faster than the renderer, gap detection when the connection drops, snapshot vs delta reconciliation, and reconnect strategies. If the only sample code is "load this CSV and render", that library has never been used at scale.
The seven business questions to ask
Technical requirements eliminate libraries that cannot work. Business questions eliminate libraries that can work but will hurt you to live with.
- Who else has shipped a production app on this? Names of customers, screenshots of live integrations, npm download trends. Not blog testimonials.
- Where is the team? Two-person teams in a different timezone with no SLA are different from a company you can call. Both can be fine; you need to know which one.
- What is the update cadence? Six months between minor releases means slow bug fixes. Daily commits to main means stable enough for production?
- Where is the data layer? The library should not embed your exchange feed. If it does, you are coupled. If it requires you to write the adapter, that is fine but plan for the work.
- What is the cost at year 3? Some libraries are free for one developer and $30K for ten. Some are $2K per developer forever. Project both curves.
- What happens when you outgrow the off-the-shelf indicators? A scripting language scales much better than a fork.
- What happens if the vendor disappears? Open-source has a community. Closed-source enterprise has a source escrow clause. SaaS without source is a single point of failure.
The build-it-yourself estimate
Before committing to any library, sanity-check the buy-vs-build trade-off. Building a depth-heatmap chart engine from scratch is not a weekend project; it is roughly an 18–24 month engineering investment for a small team. The rough breakdown for a real product (not a demo):
- Render core — canvas paint pipeline, multi-layer compositing, pan/zoom math, crosshair: 3–4 engineer-months.
- Heatmap matrix — column append in O(rows), historical backfill, time-aggregation when zoomed, palette interpolation: 2–3 engineer-months.
- Candle layer — OHLC ingestion, tick-to-bar aggregation, indicator API, drawings: 3–4 engineer-months.
- Footprint cells — trade-tape ingestion, aggressor classification, bid×ask split rendering, POC, imbalance detection: 3 engineer-months.
- Indicators library — 20–30 standard indicators, each thoroughly tested: 3–4 engineer-months.
- Data adapter — WebSocket abstraction, reconnect, backpressure, gap handling: 1–2 engineer-months.
- License / billing / packaging — for shipping it as a library to customers: 1–2 engineer-months.
That is roughly 18 engineer-months minimum for a small team that already knows the domain. At a loaded cost of $120–180K per engineer-year, the all-in price tag is $200K–$300K of engineering investment, plus ongoing maintenance.
If your product can amortise that cost over a meaningful customer base, building is rational. Otherwise the math always favours buying — even at a per-developer commercial price — because the library vendor is amortising the same cost across hundreds of customers.
A practical rubric
Score every candidate on the 14 dimensions below. Anything that hits the deal-breakers (#1, #2, #3) gets cut before scoring the rest.
| # | Dimension | Deal-breaker? | What "yes" looks like |
|---|---|---|---|
| 1 | Heatmap and candles in one canvas, one render frame | Yes | Demo video pans both layers at 60 fps |
| 2 | Real-time column append, O(rows) cost | Yes | Benchmark with live WS pumping 10 Hz |
| 3 | Headless / native-speed / WebGL rendering, not DOM-per-cell | Yes | Vendor names the render strategy in docs |
| 4 | Trade-tape ingestion and footprint cells | No, but | Bid×Ask split, POC, imbalance overlays |
| 5 | Indicator extensibility (plugin API or DSL) | No, but | Docs show a worked example |
| 6 | License model matches your stage | No, but | Tier ladder, named pricing, written terms |
| 7 | Real-time data adapter, not import-CSV-only | No, but | Reconnect / backpressure docs exist |
| 8 | Mobile / touch / responsive rendering | No, but | Demo on an iPad, two-finger pan working |
| 9 | Theme / customisation depth | No, but | Palette tokens, not hard-coded colours |
| 10 | Drawing tools (lines, rects, fib) | No, but | Persistent across pan, multi-symbol |
| 11 | Multi-pane (subplots) | No, but | Indicators in lower panes, axes shared |
| 12 | Documentation quality | No, but | Live sandboxes, not just API reference |
| 13 | Active maintenance | No, but | Recent commits, recent npm release |
| 14 | Support response time | No, but | Written SLA or community quality measured |
Apply this rubric to your shortlist of candidates — including ours. We are confident our scores stack up; we are also confident that not every team is the right fit for every library. The rubric will tell you which one fits you.
Where we fit on the rubric
We will not score competitors. We will score ourselves directly so you have a reference point.
| # | Dimension | kline-orderbook-chart |
|---|---|---|
| 1 | Heatmap + candles, one canvas | Yes. One native-painted canvas, both layers in the same frame |
| 2 | Real-time column append | Yes. O(rows touched) append, validated at 10 Hz |
| 3 | Headless / native rendering | Yes. Native engine binary, no DOM per cell |
| 4 | Trade-tape ingestion + footprint | Yes. Bid×Ask / Delta / Volume modes, POC, 6 signal types |
| 5 | Indicator extensibility | Yes. Plugin API plus DeltaDSL scripting language |
| 6 | License model | Tier ladder from $890/yr (single dev) up to OEM |
| 7 | Real-time data adapter | Yes. WebSocket adapter with reconnect + gap handling |
| 8 | Mobile / touch | Yes. Tested on iOS Safari and Android Chrome |
| 9 | Theme depth | Palette tokens via CSS variables, dark + light shipped |
| 10 | Drawing tools | Lines, rects, fibs, arrows, persistent across symbols |
| 11 | Multi-pane | Yes. Indicator subplots with shared time axis |
| 12 | Docs | API ref + live sandboxes + integration guides |
| 13 | Maintenance | Weekly releases, public changelog |
| 14 | Support | Email + Discord, response within 24 h on commercial tiers |
If you score every candidate honestly and we land near the top, we are a good fit. If a different library scores higher on dimensions that matter for your stack — say, a stronger desktop integration if you build a desktop product — buy that one. The rubric exists so you can decide; we do not have to win every comparison to win the ones that matter.
When buying our library does NOT make sense
It is worth being explicit about who we are not for, so you do not waste time integrating and then regret it:
- You only need a candle chart, no orderbook depth, no footprint. A general-purpose open-source candle library is the right call. We are overkill.
- You are building a non-trading visualization (BI dashboards, log charts). Use a general charting library; depth heatmap is not what you need.
- You need a no-code charting product for end users to build their own dashboards. A SaaS charting product, not a developer library, is the answer.
- You require WebGL-grade rendering on 100K+ point time-series with no orderbook context. A scientific-charts library will out-perform us in pure-line-series throughput.
- You require zero subscription, OSS-only. A permissive open-source candle library is the right call. Accept that you cannot ship the heatmap feature for free.
What to do this week
- Build your candidate shortlist. Three to five libraries is plenty; more becomes paralysis.
- Run each through the 7 technical requirements. Cut anything that fails one of the three deal-breakers.
- For survivors, build a 3-day spike. Render real candles, drop in a real heatmap matrix, point a live WebSocket at it. Three days will tell you what three weeks of reading docs cannot.
- For the one that survived the spike, validate the business questions: pricing curve at year 3, support SLA, license fit, escape hatch if the vendor disappears.
- Commit. Re-architecting away from a chart library mid-product is painful; do the homework once and pick well.
Where to go next
- Trading Chart With Depth Heatmap: A Practical Guide — what the chart actually looks like in production and how the data flow works.
- How to Read an Orderbook Heatmap — 5 Patterns Every Order Flow Trader Must Know — the trader-facing companion to this developer post.
- What Is a Footprint Chart? The Complete Guide — the second view in the order-flow stack.
Reference rubric scored on kline-orderbook-chart. Free for development; commercial licences from $890/yr. Score every candidate yourself; we are confident in our column.