Stacked Imbalances on a Footprint Chart: Setup, Reading, and Trading
Stacked imbalances are the most-watched footprint signal. Learn the diagonal vs horizontal detection methods, how to calibrate ratio and min rows, what bullish and bearish stacks mean, and how traders use them in practice.
A stacked imbalance is the single most-watched event on a footprint chart. It is the moment when one side — aggressive buyers or aggressive sellers — dominates not just one row but multiple consecutive price rows inside the same candle. That repetition is what separates a meaningful commitment from random tick noise.
Detected correctly, stacked imbalances are some of the cleanest order-flow signals a chart can show. Detected incorrectly, they tag every candle and become noise. This guide explains how the detection works, how to calibrate it for your instrument, and how experienced traders actually use the zones once they appear.
We will reference the detection settings exactly as they appear in our charting engine (kline-orderbook-chart), but the underlying logic is the same across every serious footprint implementation. The concepts translate to any modern platform with the right detection knobs exposed.
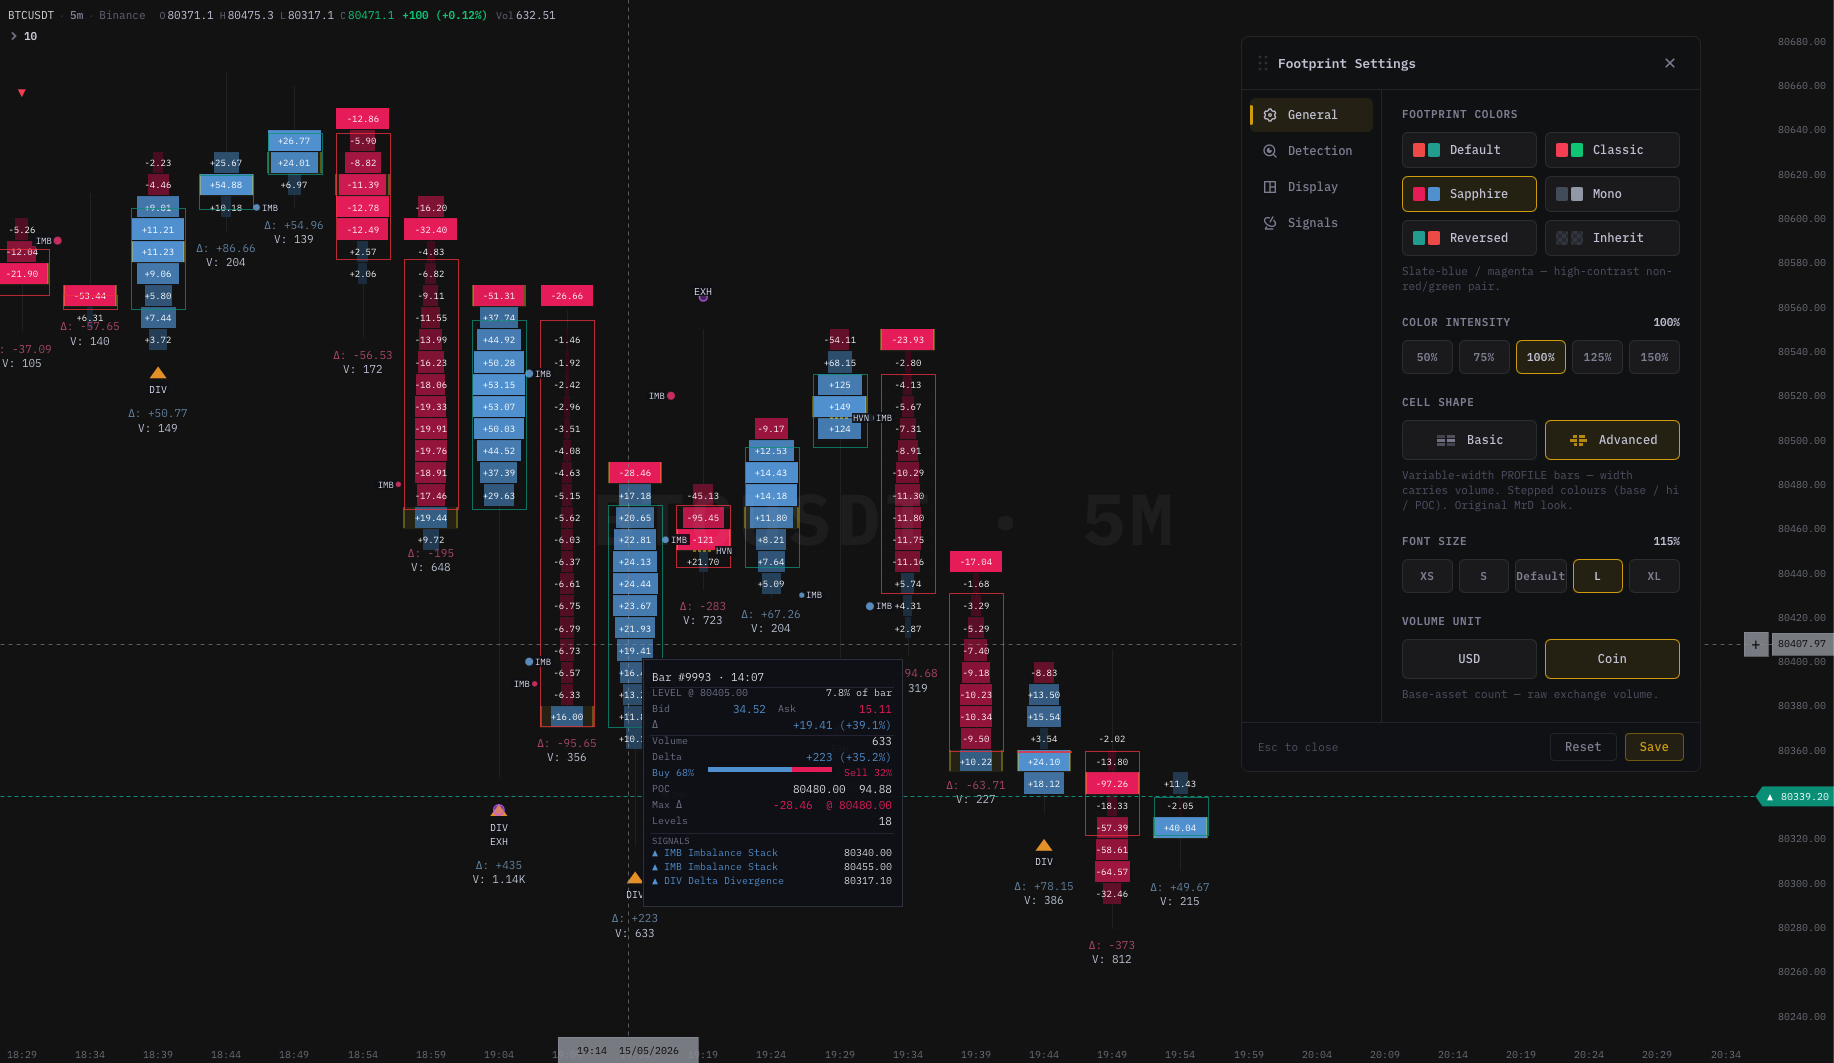 Stacked imbalance zones rendered inline on a footprint chart. Green tints +
 ] bracket mark a bullish stack; red tints + [ bracket mark a bearish stack. The detection engine flags zones automatically based on diagonal ratio + minimum row count.
What an imbalance actually is
Step one before stacking: understand the single-row imbalance.
Inside any candle, the engine records two volume buckets at each price row:
- Bid-initiated volume — aggressive buys that lifted the offer at that price.
- Ask-initiated volume — aggressive sells that hit the bid at that price.
When one bucket is many times larger than the other at the same or adjacent price, that row is imbalanced. A 2:1 split is mildly unbalanced. A 5:1 split is meaningfully unbalanced. A 10:1 split is near-absolute dominance.
A single imbalanced row by itself is not a signal. Spread, latency, and aggregation can produce one-tick lopsided cells all day long. The pattern only becomes meaningful when the same directional lopsidedness repeats across consecutive rows. That is what "stacked" means: not one imbalanced row, but a vertical run of them.
The two detection methods — Diagonal vs Horizontal
Footprint platforms differ in how they compute the ratio. Two methods are common.
Diagonal (the professional default)
The diagonal method compares buys at price P versus sells at price P−1 (one tick lower). It is the standard definition used by professional footprint tools.
Why diagonal? It captures the way aggressive flow sequences through the ladder. When a wave of buyers lifts offers at $50,100, the natural comparison is against the sellers who were active one tick below at $50,099 just moments earlier. If buyers at $50,100 dwarf the sellers at $50,099 by 5×, you genuinely have one-sided aggression climbing the book. That is more informative than comparing buyers at $50,100 to sellers at the same $50,100, because the same-price comparison is dominated by spread mechanics.
Diagonal is the default in kline-orderbook-chart and the convention used by virtually every professional footprint implementation. Use it unless you have a specific reason not to.
Horizontal (the loose definition)
Horizontal compares buys at price P versus sells at the same price P. It is the simpler definition but a looser one — it produces more zones and more noise, because the same-price comparison naturally has more variance from spread and microstructure.
Use horizontal only if:
- You are working on an extremely thin instrument where diagonal produces zero detections, and
- You understand you will see more false positives.
For 95% of users on liquid crypto or futures pairs, stay on diagonal.
The three knobs you actually tune
Detection has three settings that change which zones the engine emits. Tuning them is calibration, not optimisation — there is no "best" combination, only one that fits your instrument and timeframe.
Ratio — how lopsided is lopsided enough?
The ratio is a multiple. It defines how much larger the dominant side must be compared to the other side at a row.
| Setting | Meaning |
|---|---|
| 250% (default) | Dominant side is at least 2.5× the other. Loose; catches many zones. |
| 500% | At least 5×. Only strong imbalances qualify. |
| 1000% | Near-absolute dominance (10×). Very rare; very high confidence when it fires. |
Start at 250%. Run it for a session on your instrument. If every candle gets tinted, the ratio is too loose for your liquidity — bump to 500%. If you almost never see zones, the instrument is too thin or the ratio is too strict — drop to 250% and consider lowering Min Rows.
A common mistake is going straight to 1000% because "strict is good." It is not. A 1000% stack on a 1-minute crypto chart fires maybe once or twice per session — too rare to build a workflow around. The point of calibration is to land at a ratio that emits roughly 3–6 zones per session at the typical price action — that is the sweet spot between signal and noise for most traders.
Min Rows in Stack — how many rows make a stack?
The minimum number of consecutive imbalanced rows needed to qualify.
| Setting | Use case |
|---|---|
| 2 | Catches smaller two-row pockets. Useful for less liquid instruments. |
| 3 (default) | Filters single-tick accidents. Good starting point for most users. |
| 4 / 5 / 6 | Only catches sustained runs. Suitable for very liquid instruments where 3-row stacks are too common. |
Start at 3. It is the universal sweet spot — strict enough to filter accidents, loose enough to catch meaningful commitment. Move up to 4 or 5 only if you find yourself ignoring half the 3-row stacks because they are too small to be interesting.
Max Age — when do old zones disappear?
Stacked imbalance zones do not vanish when the candle ends. They stay on the chart until either price retests them (filling the zone) or until they age out. Max Age controls the latter.
| Setting | Behaviour |
|---|---|
| All | Every unfilled zone stays visible forever. Good for backtesting or chart review. |
| 50 / 100 / 200 bars | Hides zones older than the cap on the active timeframe. |
On a 1-minute chart, 50 bars is roughly 50 minutes — short-term reference only. On a 15-minute chart, 100 bars is ~25 hours — a multi-day memory. Pick a Max Age that fits how far back your discretionary read actually cares.
If the chart starts to feel cluttered, lower the Max Age first. Old unfilled zones are often less informative than recent ones; the market structure has changed around them.
How zones are drawn
Once a zone qualifies, the engine can draw up to three visual layers. Each is independently toggleable in the Display tab of Footprint Settings.
1. Cell tinting (default on)
Each cell inside the stack gets a stronger color tint on the dominant side:
- Green tint on the right → aggressive buyers dominated at this price.
- Red tint on the left → aggressive sellers dominated.
Cells inside a full qualifying stack get stronger tint than isolated single-row imbalances, making the zone visually obvious without scanning numbers. In Bid×Ask mode the tint applies to the bid/ask bars directly. In Delta and Volume modes the cell background changes instead.
2. Stack bracket (default on)
A short three-line bracket marker appears at the edge of the candle where the zone formed:
]   ← bullish stack (buyers dominated)
[   ← bearish stack (sellers dominated)
The bracket is anchored to the origin candle — it does not extend forward or move with later bars. Use it to instantly spot which candle generated the zone when scrolling back through history.
3. Retest ray (optional, off by default)
A horizontal line extends from the zone's price range forward in time until price returns to the level.
- When price re-enters the zone, the line ends — the zone is "filled."
- With Keep Filled Rays on, the line continues in a faded style so you can see the historical sequence of retests.
- Origin Box adds a shaded rectangle behind the source candle, useful for chart review.
The retest ray is an advanced visual. If you find it clutters your active trading chart, keep it off and rely on cell tints + bracket alone. Many discretionary traders turn rays on only when reviewing sessions, not while trading them.
Reading bullish and bearish stacks
A stacked imbalance does not predict direction. It documents what happened. The trader's job is to ask what that commitment means in context.
Bullish stack (buyers dominated)
Green-tinted cells + ] bracket on the right edge of the candle. Buyers were consistently more aggressive across those price rows.
Where to use it:
- In an uptrend, on a pullback to the stack. This is the most common play. If price returns to a buying stack and holds, many traders watch for a re-entry continuation setup with a stop just below the zone low.
- After a flush-low that closes back up. A bullish stack that forms on a spike low and then closes back up may indicate absorption of selling. Combine with an explicit ABS (Absorption) signal and higher-timeframe confluence and you have a textbook reversal setup.
- At an obvious support level on first test. If the level is well-known (prior swing, daily VWAP) and a bullish stack forms on the first touch, the level just got defended explicitly.
Where to be careful:
- In open space. A bullish stack with no level around it is just a footprint of who pushed hardest on that bar. It does not imply where price goes next.
- Right into resistance. A buying stack that forms at major overhead supply may be the final lift before exhaustion — pair with DIV (Delta Divergence) or EXH (Exhaustion) signals for confirmation.
Bearish stack (sellers dominated)
Red-tinted cells + [ bracket on the left edge. Sellers were consistently more aggressive.
Where to use it:
- In a downtrend, on a retrace to the stack. Mirror of the bullish version. Watch for re-entry shorts with a stop above the zone high.
- At a resistance level on the first test or rejection bar. A bearish stack on a candle that touched a known supply level is the level being defended.
- As an early reversal flag at a top. A bearish stack on a green-closing bar (the engine flags this clearly) is one of the cleanest "fade is coming" reads in order flow.
Where to be careful:
- Mid-flush, no level. Selling stacks during a fast move are commitment, but commitment to the wrong side at the wrong time. Wait for structure to align.
Multiple stacks in one candle
Sometimes a candle prints both a buying stack near the low and a selling stack near the high. The auction was genuinely two-sided — buyers active at the low, sellers active at the high.
This usually marks a balance / range bar. Treat it as noise until one side breaks away on a subsequent bar. The level that eventually gives way often becomes the trigger.
Gap between zone and close
A useful nuance: where does the stack sit inside the candle?
- Buying stack near the low, close near the high. Buyers aggressed at the low, price drifted up. The stack is well-positioned — supports the bullish reading.
- Buying stack near the high, close near the high. Buyers aggressed at the high. Could be exhaustion of an up-move — pair with the next bar's response.
- Buying stack in the middle, close anywhere. Less informative as a level on its own; treat the candle holistically.
Read the stack's position alongside the POC and the close, not in isolation.
A first-time calibration checklist
If you have just enabled stacked imbalances and want to land on usable settings fast, do this:
- Open Footprint Settings → Detection.
- Toggle Stacked Imbalances on.
- Leave Mode = Diagonal, Ratio = 250%, Min Rows = 3.
- Go to Display tab — confirm Cell Highlights and Stack Bracket are on; Retest Ray off for now.
- Scroll back through 50–100 bars on your active instrument and observe.
- If every candle is tinted: ratio is too loose. Bump to 500%.
- If you see almost no zones: ratio is too strict or instrument is too thin. Drop to 250% if you raised it, then lower Min Rows to 2.
- Repeat once more if needed. After two passes you should have a sensible setting for that instrument.
Calibrate per instrument. BTCUSDT and ETHUSDT need different ratios. CME ES and NQ need different ratios. Once you have a working pair (Ratio + Min Rows), stick with it for a few weeks before retuning — chart-time matters.
How to trade a stack — execution rules
A zone on the chart is information. Execution rules turn information into a trade. Useful constraints we have seen experienced traders use:
- Require a level. Do not trade stacks in open space. Always pair with a structural reason (prior swing, VWAP, range boundary).
- Require trend alignment for continuation trades. Buying stack + uptrend = continuation. Buying stack + downtrend = potential reversal, but needs more.
- Wait for the retest, not the origin. Most stacks form during fast moves. Entering on the origin bar is chasing; entering on the first retest gives you a defined stop and a reference for invalidation.
- Define your stop on the zone, not on a fixed price. If the zone runs from $X to $Y, the stop is just past the far side. If price closes through the zone, the read is invalid — that is your real exit.
- Stack count is not strength. A 6-row stack in thin conditions can be weaker than a 3-row stack in a liquid fast move. Calibrate; do not chase row counts.
- Combine with absorption or HVN. A stack alone is one signal. A stack at a level with a confirming absorption print or a known HVN is several signals reinforcing each other.
Common mistakes
| Mistake | Better approach |
|---|---|
| Acting on every stack regardless of context | Require a structural reason before treating a stack as actionable |
| Confusing stack count with strength | A 6-row stack in thin conditions is weaker than a 3-row stack in a liquid fast move |
| Ignoring tick size | Changing aggregation changes which rows group together; re-check ratio calibration after any tick change |
| Overloading visuals | Start with cell tints only. Add bracket. Add retest ray only after you are comfortable |
| Mixing horizontal and diagonal on the same chart | Pick one method per instrument and stay there |
| Trading the origin candle | Almost always too late. Wait for the retest |
Stacked imbalances are one signal among many
Even with perfect calibration, stacked imbalances are one signal in a larger order-flow stack. The strongest setups happen when multiple signals reinforce each other on the same bar or zone:
- Stacked imbalance + ABS (absorption) + level = high-conviction reversal setup.
- Stacked imbalance + trend alignment + HVN retest = high-conviction continuation setup.
- Stacked imbalance + DIV (delta divergence) at the same extreme = exhaustion of one side.
We unpack the other footprint signals in How to Read a Footprint Chart: 8 Patterns Every Trader Must Know, and we cover the orderbook side of the order-flow stack in How to Read an Orderbook Heatmap.
Where to go next
- What Is a Footprint Chart? The Complete Guide — start here if you are new to the chart type.
- How to Read a Footprint Chart: 8 Patterns Every Trader Must Know — the full tactical pattern guide.
- Footprint Chart vs Candlestick Chart: Why You Need Both — head-to-head with the chart type you already use.
- How to Read an Orderbook Heatmap — 5 Patterns Every Order Flow Trader Must Know — the companion view to the footprint.
Stacked imbalance detection powered by kline-orderbook-chart. Configurable diagonal/horizontal mode, 250%/500%/1000% ratio, 2–6 minimum rows, and three visual layers. Free for development; commercial licences from $890/yr.