Footprint Chart vs Candlestick Chart: Why You Need Both
A head-to-head comparison of footprint and candlestick charts. What each one shows, what each one hides, the data each requires, and how to combine them in one workflow. With concrete examples of when the footprint changes your read.
If you have ever looked at a candle close at a key level and wondered "was that close real, or did sellers absorb every push?" — that question is the entire reason footprint charts exist. The candlestick gave you the result. The footprint tells you how the bar got there.
This guide is a head-to-head: candlestick chart versus footprint chart. What each one shows, what each one hides, what data each requires, and — most importantly — when each one earns its keep in real trading. You will not need to pick one. By the end you will see why most professional order-flow traders run both, often in the same chart window.
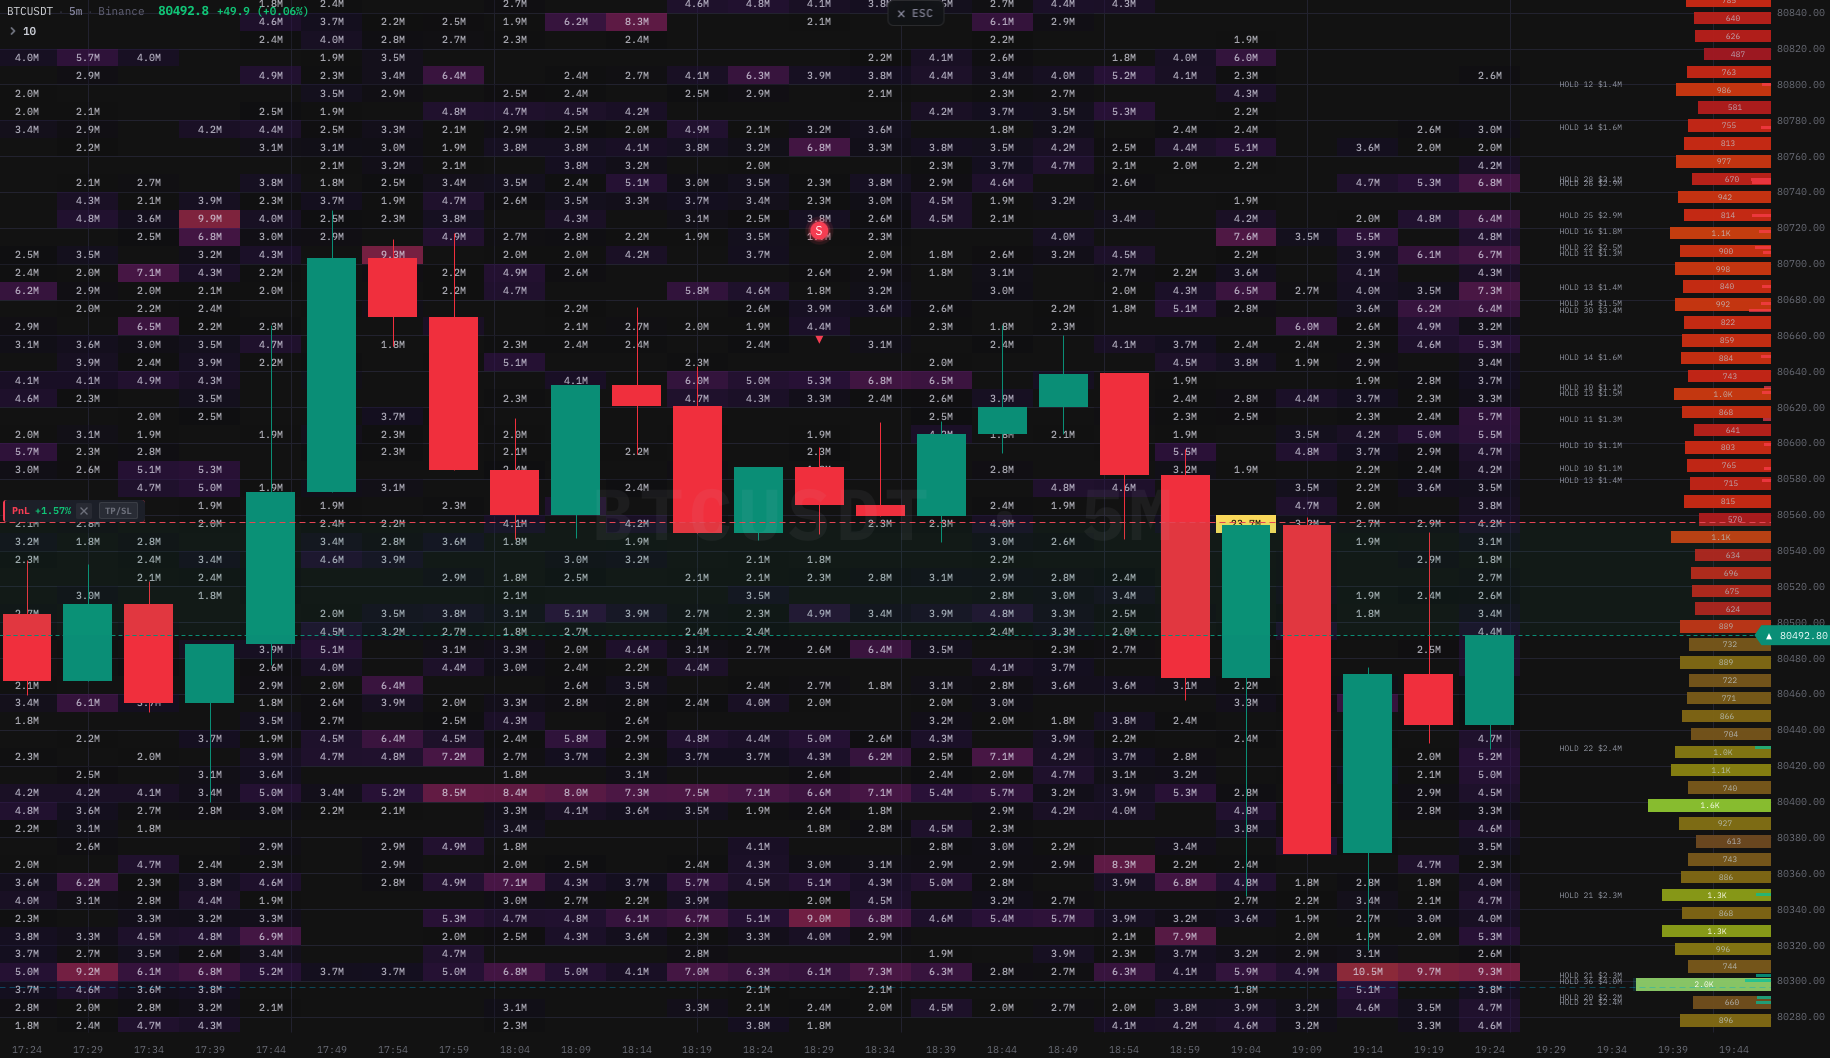 Candlesticks, depth heatmap, and footprint in one canvas. The candle gives you structure; the footprint shows you the microstructure; the heatmap shows the resting liquidity. Three views, one read.
What a candlestick actually is
A candlestick is a summary. Each bar collapses every trade in its time window into four numbers — open, high, low, close — plus a single total volume bar underneath.
It is brilliant at three things:
- Structure across many bars. Trends, ranges, swings, breakouts — all jump out instantly. Two hundred candles on a chart and you can read market state in two seconds.
- Pattern recognition. Engulfings, pin bars, inside bars, doji — the canonical language traders have used for 250+ years. Everyone reads it.
- Timeframe portability. The same chart type works at 1m, 5m, 1h, 1D, 1W, 1M with no extra data. Just OHLC tuples.
It is also genuinely limited:
- No price-level detail. A candle that ranged $50,000–$50,500 tells you the range, but not whether 80% of the volume traded between $50,100–$50,200 or spread evenly across the range.
- No aggressor info. A candle with 1,000 BTC of volume does not tell you whether 700 BTC were aggressive buys or aggressive sells. The volume bar is one number.
- No microstructure timing. You cannot tell whether the buying happened in the first quarter of the bar or the last quarter.
For decades, that limitation was just accepted. Tape readers tried to fill the gap manually. The footprint chart is what happens when you let a machine do that work.
What a footprint actually is
A footprint chart shows trade volume at every individual price inside each candle, split between aggressive buyers and aggressive sellers.
Each candle is exploded into rows by price (one row per tick, or aggregated when zoomed out). Each row carries two numbers: bid-initiated volume (aggressive buys that lifted offers) and ask-initiated volume (aggressive sells that hit bids). The engine draws those numbers — as a Bid×Ask split, a Delta bar, or a Volume bar — directly inside the candle's range.
This single change adds three things the candle cannot show:
- Where in the price range the volume happened. You see exactly which rows traded heavily and which traded thinly.
- Who was the aggressor. Every cell shows the buy-sell split.
- The POC. The highest-volume row in each bar is highlighted — a quantitative read of "where did this bar concentrate its energy?"
The footprint is not a different way to look at price. It is the same price action, exploded one level deeper. The candle is the wrapper; the footprint is the contents.
If you are new to the format itself, our complete footprint chart guide walks through the three display modes (Bid×Ask, Delta, Volume), how aggressor classification works, and the core terminology.
Head-to-head: what each view shows
| Dimension | Candlestick | Footprint |
|---|---|---|
| Data per bar | 4 numbers (OHLC) + 1 volume number | One row per tick (or aggregated step), each with bid + ask split |
| Reads structure | Excellent — designed for it | Poor — too dense to scan over many bars |
| Reads microstructure | None | Excellent — that is the entire point |
| Aggressor information | None | Built in |
| POC (highest-volume price) | Not visible | Highlighted on every bar |
| Imbalances | Not visible | Detected and tagged |
| Absorption events | Inferable only from shape (wicks) | Detected explicitly |
| Data required | Klines only | Klines + raw trade tape (with aggressor flag) |
| Works on any timeframe | Yes | Yes, but reads best on lower timeframes (≤15m) |
| Read speed across 100 bars | < 5 seconds | Not feasible — wrong tool for that job |
The pattern should be obvious: the two views are complements, not substitutes. A candlestick chart is the right tool for reading structure across many bars. A footprint chart is the right tool for reading microstructure inside a single bar. Both questions matter, just at different moments.
What a footprint changes about how you read a bar
Concrete examples make the difference click. Here are four common candlestick patterns and what the footprint adds to each.
1. The pin bar at support
Candle view: A long lower wick rejects support; the body closes near the high. Classic bullish pin. Traders interpret it as "buyers stepped in at support and pushed back up."
Footprint adds:
- Was the rejection actually defended, or did price just drift back up on no volume? The footprint shows whether the lower wick contained heavy ask-initiated volume (sellers fired hard and got absorbed — bullish) or thin volume (sellers never seriously committed — less bullish).
- Did buyers actually aggress, or did they just sit on bids and let sellers exhaust? The bar delta tells you. Positive delta = buyers genuinely lifted. Negative delta but a bullish close = absorption.
- Where is the POC? If the POC is near the low with green delta, buyers committed at the level. If the POC is near the high with red delta, buyers drifted but did not commit.
A pin bar with stacked buying near the wick and a green POC near the low is a vastly stronger setup than a pin bar with no footprint signal at all.
2. The bullish engulfing
Candle view: A red candle followed by a green candle that fully engulfs it. Traders interpret it as a momentum shift.
Footprint adds:
- Was the engulfing supported by delta? A bullish engulfing on +8,000 delta is meaningfully different from one on −2,000 delta (the price went up despite net selling — possible exhaustion of sellers, but also possible bull trap).
- Were imbalances stacked? A stacked buying zone inside the engulfing candle is the engine's quantitative confirmation that buyers truly committed.
- Did the POC of the engulfing bar sit above the prior bar's POC? POC rotation up bar-to-bar is the cleanest "value migrating up" signal.
3. The breakout that fails
Candle view: Price breaks above a key resistance, then closes back below it. Classic failed breakout, often called a fakeout.
Footprint adds:
- Was the breakout driven by aggression or by thin tape? A breakout candle with strong positive delta and stacked buying shows real commitment — when it fails, it fails because of new selling, not just because nobody was buying. A breakout candle with weak delta and no stacks was always thin — its failure was just gravity.
- Did the engine fire an ABS (Absorption) signal at the high? If yes, the failure was already signposted — passive sellers absorbed the aggression at the level. Same goes for a DIV (Delta Divergence) print if price made a new high with negative delta.
4. The doji at a level
Candle view: Open and close at nearly the same price, range may be wide or narrow. Traders interpret it as indecision.
Footprint adds:
- Indecision in what way? A doji can hide a 50/50 split (genuine balance) or a 50,000-row two-sided slugfest (active two-sided trade). The footprint shows you which one.
- Was the wick volume on the upper side absorbed, lower side absorbed, or both? A doji with stacked selling on the high and stacked buying on the low is a two-sided rejection — much more meaningful than a doji on thin volume.
In every example the footprint did not replace the candle read; it graded it. Some bullish patterns are quantitatively confirmed; some are just shapes that happen to look bullish. The footprint distinguishes.
What each view requires under the hood
Practical consideration that often decides which view a trader can actually use: data.
Candlestick
OHLC bars are public, free, and available on every exchange and every broker since forever. You can get years of historical 1m candles on BTC from any free API. There is no reason any trader should be without a candlestick chart.
Footprint
A footprint needs the raw trade tape — every individual trade with its price, size, and aggressor side — to build the cells. That is a higher bar:
- Real-time: every major exchange streams the trade tape over WebSocket for free. Crypto exchanges and most futures venues are well-covered.
- Historical: trade-level history is heavier than candle history (often by 100×). Free APIs typically only offer recent windows; deep historical replay usually needs a paid data provider.
- Aggregated alternative: some platforms accept pre-aggregated footprint clusters from the backend instead of raw trades. As long as the aggregator computed aggressor classification correctly, this works just as well for the display layer.
For most modern crypto and futures traders this is a non-issue — the data is there. For very thin instruments, fragmented venues, or specialised historical replay, a footprint may not be feasible.
When to use each — the practical rule
After a few months of using both views, most order-flow traders converge on the same workflow.
Use candlesticks for:
- Higher-timeframe structure. Where is the trend? Where are key levels?
- Multi-bar pattern recognition. Engulfings, pin bars, ranges, breakouts.
- Pre-trade analysis. What is the setup, what is the bias, where are stops?
- Anything that requires reading 50+ bars at once.
Use footprints for:
- Confirming a structural setup with order-flow evidence. Is the breakout real?
- Reading micro-context inside a key bar. What happened inside the candle?
- Detecting absorption, stacked imbalance, divergence — events the candle cannot show.
- Live trade management. Is the trend still being supported by aggression, or is it on inertia?
- Anything that asks who was committed and where.
Concretely: you scan with candles, you confirm and time with footprints.
The integrated chart — why pros run both at once
Here is the workflow most experienced order-flow traders end up with:
- Main chart: candlesticks on the timeframe they trade. Maybe 1m or 5m for scalps; 5m or 15m for intraday swings.
- Footprint: rendered inline on the same chart — every candle exploded into bid/ask cells in real time. Color tints mark stacked imbalances; signal labels fire on ABS/IMB/DIV/EXH/UA/HVN events.
- Orderbook heatmap: rendered as a separate raster behind the candles, showing resting liquidity at each price over time.
- Delta strip: a thin pane under the chart showing per-bar delta.
In this integrated view, the candle is structure, the footprint is execution detail, the heatmap is resting context, and the delta strip is the running aggression. Together they answer almost every question a discretionary order-flow trader needs to ask in real time — without flipping between separate windows.
For decades this kind of view was only available in expensive desktop platforms running native code on Windows. Modern native-engine web charting libraries — including the one rendering the screenshots in this post — now do it in a browser canvas at 60 fps. If you are evaluating which library can deliver this integrated view, see our buyer's guide: Choosing an Orderbook Heatmap Chart Library: A Practical Buyer's Guide for 2026.
Common misconceptions
"Footprints are just for scalpers." Not really. Scalpers and intraday traders use them most because the time-resolution of the trade tape matches their decision horizon. But swing traders and even position traders use them at trade entry — even if you only check the footprint when entering a 2-week swing, the bar where you entered carries information worth reading.
"Footprints replace the candlestick chart." No. Footprints are too dense to read across many bars. They are inline detail on a candlestick chart, not a substitute for it. Every footprint platform shows the candle outline behind the cells.
"Footprints work better in some markets than others." True only for thin instruments where the trade rate is too low to build meaningful cells. For any liquid crypto or futures pair the view works equivalently. The patterns are universal because the underlying mechanic — aggressive buyers and sellers transacting at price — is universal.
"I do not need the footprint because I read the orderbook." The orderbook shows resting limit orders. The footprint shows what actually traded. They are different views of different objects. A wall in the orderbook tells you somebody is willing to defend; the footprint tells you whether they actually defended when price arrived. Both views are valuable, and neither replaces the other. (We covered the orderbook side in our orderbook heatmap reading guide.)
How to add a footprint to your workflow this week
If you have never used a footprint chart and want to try one this week, here is the minimum viable setup:
- Pick one instrument. BTCUSDT, ETHUSDT, or your preferred futures contract. Liquid enough to have meaningful trade volume.
- Pick one timeframe. Most traders start with 5m — wide enough that each candle has interesting footprint cells, narrow enough to see multiple setups per session.
- Set tick aggregation so each bar shows roughly 8–20 rows. Too few rows and you cannot see imbalances; too many and the chart becomes noisy.
- Enable Bid×Ask mode for the first week. It is the most information-dense view; you can switch to Delta or Volume later once your eye is trained.
- Enable stacked imbalance detection. Default settings (Diagonal, Ratio 250%, Min Rows 3) are a good starting point. Calibrate after a session if every bar is tinted. See our stacked imbalances guide for details.
- Run replay on yesterday's session. Click bar-by-bar through the high-volume hour. Note where each pattern you learned about appears. Build pattern memory before you trade live.
- Add the footprint as a confirmation tool first. Keep trading your usual candlestick-based setups. When you would normally enter, glance at the footprint and ask: does the order flow agree?
After a few weeks you will start noticing setups where the footprint changes your answer — bars where the candle said one thing and the order flow said another. That is the signal that the view has earned a place in your workflow.
Where to go next
- What Is a Footprint Chart? The Complete Guide for 2026 — the full primer with display modes and terminology.
- How to Read a Footprint Chart: 8 Patterns Every Trader Must Know — every pattern the engine flags, plus the structural reads.
- Stacked Imbalances on a Footprint Chart: Setup, Reading, and Trading — the single most-used footprint signal.
- Trading Chart With Depth Heatmap: A Practical Guide — the third leg of the order-flow stack.
Both views rendered with kline-orderbook-chart — candles, footprint, depth heatmap, and delta strip in one native-engine canvas at 60 fps. Free for development; commercial licences from $890/yr.