RSI as a Momentum Instrument: Value and Structure
What RSI really measures: momentum, not overbought/oversold. RSI momentum value (Cardwell range rules), structure (Baeyens), and why momentum leads price.
Abstract. The Relative Strength Index (RSI) is commonly taught as an overbought/oversold oscillator and applied as a mean-reversion trigger. This article develops and formalizes an alternative reading in which RSI is treated as a momentum instrument with two complementary dimensions: momentum value (the level of the oscillator interpreted relative to the active regime) and momentum structure (the geometry of the RSI line — its swings, trendlines, ranges, and cross-timeframe correlation). We trace the methodology through its primary sources (Wilder, 1978; Cardwell's Range Rules; Hayden, 2004; Baeyens' multi-timeframe structural work), derive the relevant properties directly from the public RSI formula, give a calculus argument for why momentum structure tends to lead price, present a worked case study, and specify a step-by-step application protocol. We close by stating the limitations of the static-threshold model as a set of falsifiable, testable claims. The aim is to make the framework precise enough that it can be both applied and independently verified on out-of-sample data.
RSI is most often introduced through a single rule: sell above 70, buy below 30. The rule is simple and, in range-bound conditions, serviceable. It also captures only a small part of the information the indicator carries, and in trending conditions it frequently misclassifies the market.
This article gives a thorough treatment of the two dimensions that the fixed-threshold view omits: RSI momentum value and RSI momentum structure. Both are documented in the primary literature, both descend from the body of work that defines the modern interpretation of RSI, and both are the operational basis for evaluating momentum across many markets at once. The treatment is organized so that, by the end, a reader can (a) state precisely why the static 70/30 model is incomplete, (b) interpret RSI as its source literature intends, and (c) apply a defined procedure to their own data.
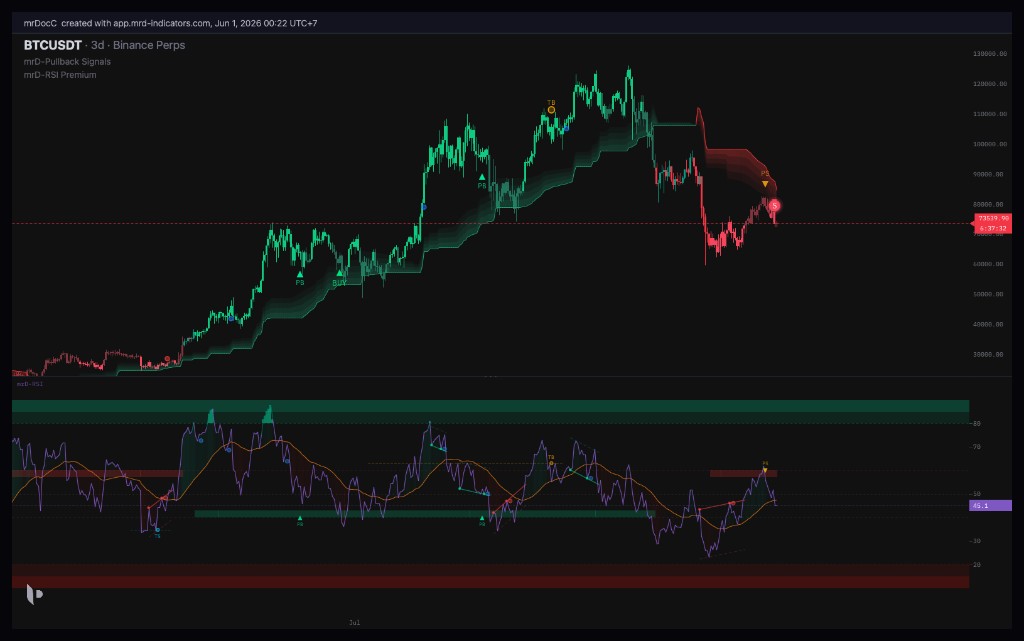
 The RSI panel read as a momentum system rather than a fixed-threshold oscillator: the line carries the momentum value, the bands and range zones encode the regime, and the multi-timeframe table places the current reading in cross-timeframe context.
Part I — What RSI actually measures
1.1 Wilder's instrument (1978)
RSI was introduced by J. Welles Wilder in New Concepts in Technical Trading Systems (1978). The formula is public domain and worth restating exactly, because nearly every misunderstanding begins with people who have never looked at it:
RSI = 100 − ( 100 / (1 + RS) )

RS  = average gain / average loss        (over n periods, default n = 14)
The averages use Wilder's smoothing, a recursive average closely related to an exponential moving average:
avg_gain_t = ( avg_gain_(t−1) × (n − 1) + gain_t ) / n
avg_loss_t = ( avg_loss_(t−1) × (n − 1) + loss_t ) / n
where gain_t and loss_t are the positive and negative parts of the period-over-period price change. This smoothing is why RSI reacts but does not whip: each new bar nudges the average rather than replacing it.
1.2 Three properties that fall straight out of the formula
Everything in this article is a consequence of three facts you can read off the equation:
- RSI is bounded on 0, 100.
RSranges from 0 to infinity, and the map100 − 100/(1+RS)is a smooth, monotonic compression of[0, ∞)onto[0, 100). RSI can never leave the band. This bound is not cosmetic — it is the property that makes RSI comparable across instruments and timeframes, because every market, however volatile, is projected onto the same fixed scale. - RSI = 50 is equilibrium. When average gain equals average loss,
RS = 1andRSI = 50. The mid-line is therefore not arbitrary: it is the exact level at which buying and selling pressure have been balanced over the lookback window. Above 50, gains dominate; below 50, losses dominate. - RSI is a smoothed, normalized rate of change. It is constructed from the changes in price, so it is a measure of price velocity, bounded and normalized. RSI is, in the most literal mathematical sense, a momentum oscillator — not a price level, a momentum. (Formalized as a normalized net-to-gross momentum ratio in Appendix A.4.)
For readers who want the formal treatment — the closed-form sigmoid identity, the sensitivity law that explains why RSI "saturates" near the extremes, the geometric memory of Wilder smoothing, and the calculus proof that the momentum peak strictly precedes the price peak — the derivations live in Appendix A and are referenced inline below.
1.3 What Wilder himself said — and didn't
It is fair to Wilder to note that his original framework already went beyond 70/30. He documented divergence (RSI disagreeing with price at extremes) and failure swings (a structural pattern in the RSI line itself). Both are structure reads. So the idea that "RSI is only overbought/oversold" is not even faithful to the 1978 source. The 70/30 fade is the part of Wilder that survived in popular teaching; it was never the whole of Wilder, and it is certainly not the whole of RSI after four further decades of work.
The remainder of this article develops the two dimensions that the popular teaching dropped.
Part II — RSI momentum value: the level as a regime gauge
The first dimension is momentum value: the claim that the number itself carries meaning about the strength and regime of momentum, and — crucially — that the same number means different things in different contexts.
2.1 The problem with a static threshold
Start with the empirical failure that motivated everything that follows. Take the naive rule literally: short every time RSI crosses above 70, cover when it falls back under. In a range-bound market this can work — price oscillates, RSI oscillates, you fade the extremes. But in a trending market it is a documented way to lose money, because RSI can ride the 70–90 band for the entire duration of a strong uptrend. The fader shorts at 70, gets run over to 75, again to 80, and is stopped out repeatedly while the trend the RSI was correctly describing as strong continues.
A model that systematically fails in the single most profitable market condition is not a model you can build on. The static threshold is not "wrong everywhere" — it is wrong precisely where it matters most. That failure is the door through which the value dimension enters.
2.2 Cardwell's Range Rules
In the 1980s and 1990s, Andrew Cardwell — who studied and taught Wilder's interpretation directly — made the decisive post-Wilder discovery: in a trending market, RSI does not roam the full band. It operates inside a range, and which range it occupies defines the trend.
- Bull trend: RSI tends to oscillate between roughly 40 and 80, with the 40–50 zone acting as support — momentum pullbacks die there and turn back up.
- Bear trend: RSI tends to oscillate between roughly 20 and 60, with the 50–60 zone acting as resistance — momentum rallies stall there and roll back down.
- The 40–60 band is the battleground. Which boundary holds — the bull-support floor near 40 or the bear-resistance ceiling near 60 — tells you which regime you are actually in.
These are the published RSI Range Rules, and they reframe the entire indicator. An RSI reading of 75 inside a confirmed bull range is continuation, exactly what a healthy uptrend is supposed to print — not a top. A reading of 28 inside a confirmed bear range is continuation — not a bottom.
 Cardwell's range rules made visual: in a bullish regime the lower-40s act as momentum support and pullbacks resume up; in a bearish regime the mid-to-high-50s act as resistance and rallies roll over. The level zone you are reacting at — not a fixed 70/30 — is what carries the momentum value.
2.3 "Overbought is strength" — the inversion
Cardwell compressed the whole reframing into one line that the static-threshold view never absorbed:
"Overbought is a sign of strength. Oversold is a sign of weakness."
This is not a paradox; it is a direct consequence of the range rules. Strong momentum lives in the upper band; weak momentum lives in the lower band. To fade an upper-band reading in a confirmed uptrend is to fade the strength that defines the trend. The value, read with its regime, points with the move, not against it.
2.4 Hayden's measurement thesis and the "range shift"
John Hayden, in RSI: The Complete Guide (2004) — also working in the Cardwell tradition — formalized the value idea into a single thesis: RSI measures momentum, and momentum is a measurable, comparable quantity. Two of his points are essential for application:
- The level is a measurement, not just a threshold. Because RSI is bounded and normalized, the value can be trusted as a magnitude. A market grinding at RSI 62 has measurably more sustained buying pressure than one at 53. Treat the number as information, not as a tripwire.
- The range shift is the trend change. When a market transitions regime, the RSI operating range itself shifts: the old bull-range support near 40 gives way, and a new ceiling near 60 forms. The first decisive failure to hold range support is one of the earliest and cleanest warnings of a regime change available in technical analysis — and it is a pure value read. You are not waiting for price to confirm; you are watching the momentum range relocate.
 A range shift: the bull-range support near 40 fails, RSI relocates into a 20–60 bear range, and a new ceiling forms near 60. The relocation of the range — not the price low — is the earliest value-level signal of a regime change.
2.5 Equilibrium and the 50-line, used in practice
Because RSI = 50 is the balance point (§1.2), the mid-line is the most under-used decision aid on the panel. Practical reads:
- Holding above 50 on pullbacks is the signature of a bull regime; rejecting from below 50 is the signature of a bear regime.
- A 50-line reclaim after a downtrend is an early, value-level hint that the range may be shifting up; a 50-line rejection after an uptrend hints at a shift down.
- The mid-line gives you a binary regime cue before you even consult the range boundaries.
2.6 Comparability — why value travels across markets
The bounded-normalized property has one more consequence that the static view cannot exploit: because every instrument lives on the same 0–100 scale, the value lets you rank momentum across hundreds of markets at once. RSI 78 on one pair and RSI 78 on another are directly comparable readings of momentum strength, regardless of price, volatility, or tick size. This is not a theory; it is the mathematical reason a multi-asset RSI matrix is even coherent — and it is what makes a market-wide momentum scan possible (Part VI).
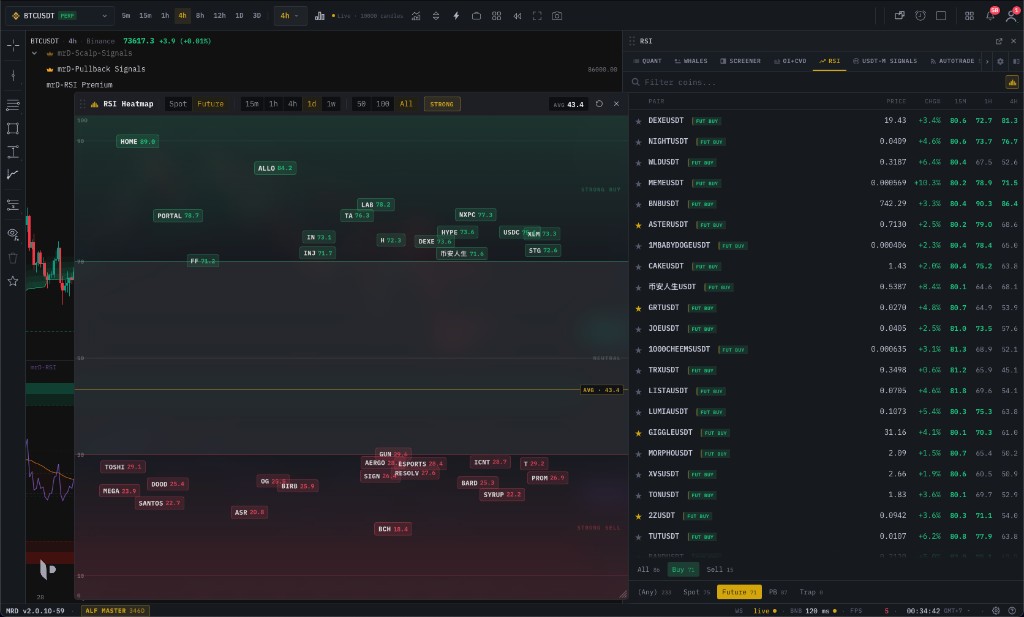 Comparability in practice: because RSI is on the same bounded scale for every instrument, hundreds of pairs can be ranked side by side. The heatmap positions each pair by its momentum value, and the table lines up the 15m / 1h / 4h readings — one screen that turns the bounded-normalized property into a market-wide momentum scan.
Part III — RSI momentum structure: the geometry of the line
The second dimension is momentum structure: the claim that the RSI line forms its own readable geometry — independent of price — and that this geometry both leads and contextualizes price.
3.1 The line has its own support, resistance, and trendlines
You can draw on the RSI line the same way you draw on price: connect its swing lows into a rising support line, connect its swing highs into a falling resistance line, mark the levels it keeps reacting at. These are not price levels; they are momentum levels. A break of an RSI support trendline frequently occurs before the corresponding price trendline breaks. The RSI line prints its own higher-highs and higher-lows, its own double tops, its own ranges. Read structurally, the oscillator is a skeleton of the move.
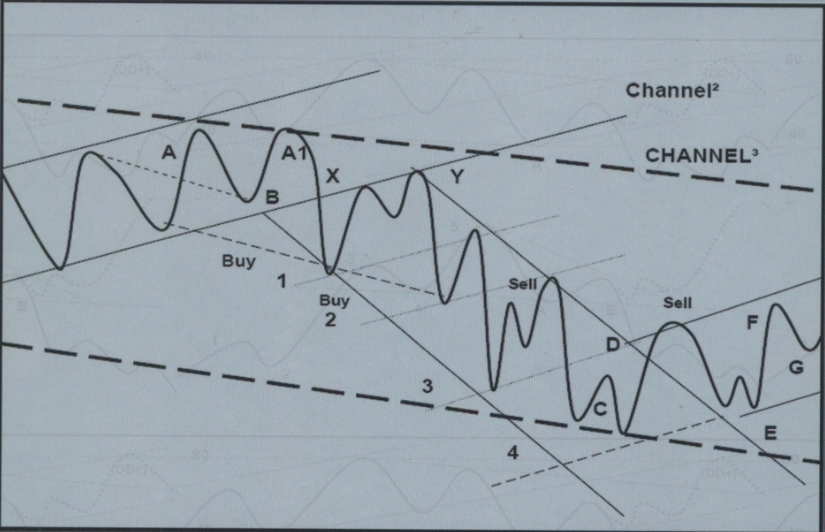
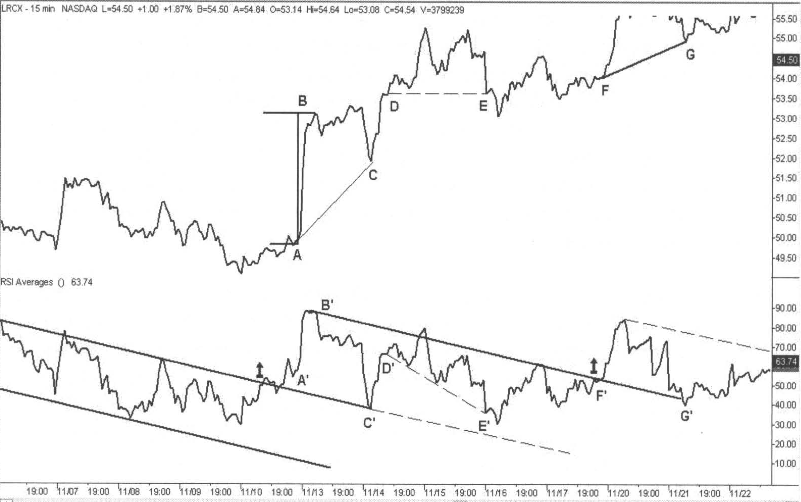 Structure drawn on the oscillator itself: the RSI swings (A′–G′) carry their own trendlines and reaction points that mirror — and frequently precede — the price swings (A–G) above. The RSI line is read like price, with its own support, resistance, and break points. Chart: Walter J. Baeyens (multi-timeframe RSI study).
3.2 Positive and Negative Reversals (Cardwell)
Cardwell also formalized the structural patterns that are the literal ancestors of what modern tools call hidden divergence:
- Positive Reversal — RSI makes a higher low while price makes a lower low. In an uptrend this is a bullish continuation read: momentum refused to confirm the price weakness, and price typically resolves upward. Cardwell even projected price targets from the magnitude of the RSI move.
- Negative Reversal — RSI makes a lower high while price makes a higher high. In an uptrend this warns that the new price high was made on weaker momentum — a bearish structure read.
These are not level reads. They are relationships between the geometry of RSI and the geometry of price, and they carry documented forecast content.
3.3 Divergence vs hidden divergence — a disambiguation
Because the vocabulary is a frequent source of confusion, here is the full map:
| Pattern | Price | RSI | Typical context | Read |
|---|---|---|---|---|
| Regular bearish divergence | Higher high | Lower high | End of uptrend | Reversal down |
| Regular bullish divergence | Lower low | Higher low | End of downtrend | Reversal up |
| Hidden bearish divergence (≈ negative reversal) | Lower high | Higher high | Pullback in downtrend | Continuation down |
| Hidden bullish divergence (≈ positive reversal) | Higher low | Lower low | Pullback in uptrend | Continuation up |
The single most common beginner error is reading a continuation pattern as a reversal pattern (or vice versa) because they only memorized "divergence = reverse." Structure has to be read with the regime (Part IV).
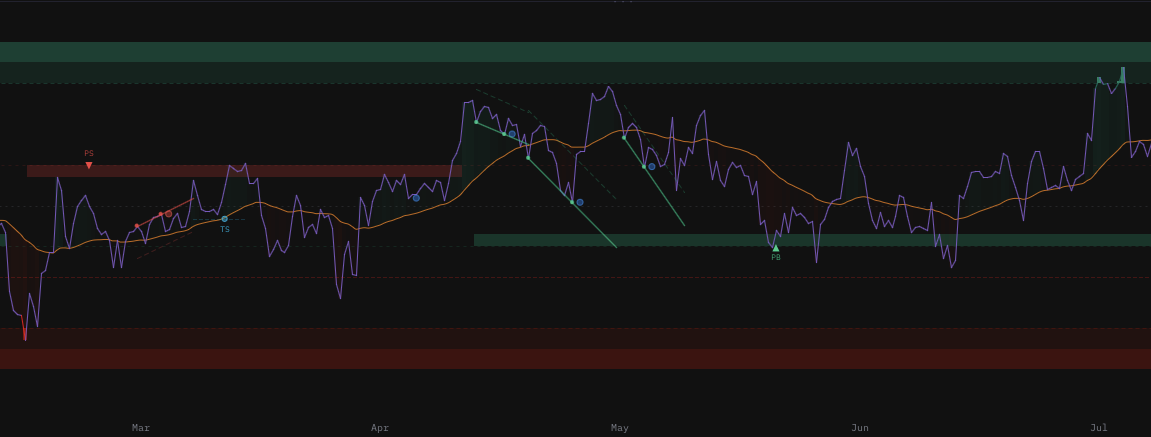
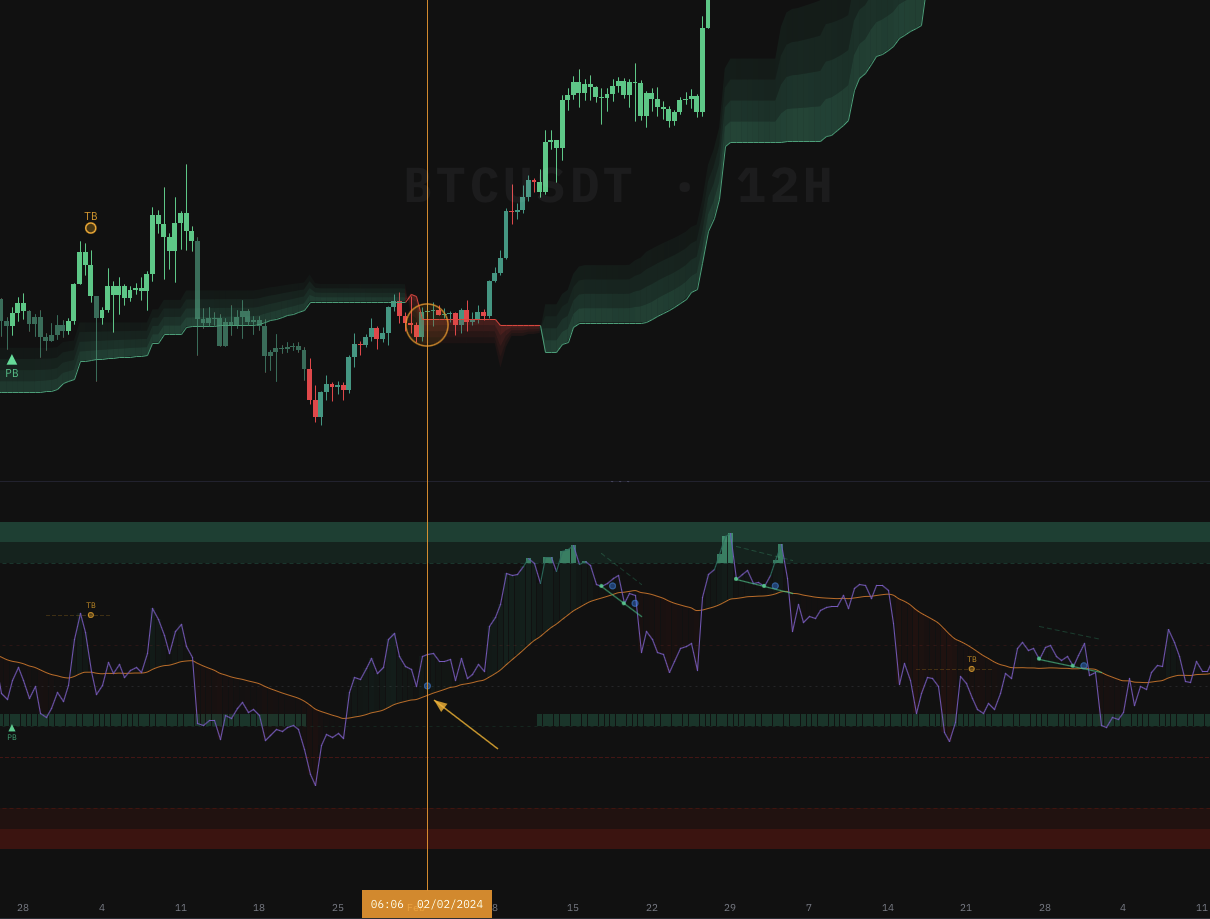 Structure in action: RSI carving a different geometry than price (a reversal/hidden-divergence read). The level alone says nothing here — the information lives in the disagreement between the RSI structure and the price structure.
3.4 Why structure leads price — the calculus
The statement "momentum structure leads price" can be made precise, at which point it reduces to a near-tautology of elementary calculus rather than an empirical conjecture.
Price is a position. Momentum is, by construction, a measure of the rate of change of price — its velocity. For any smooth trajectory that decelerates into a peak and then reverses, velocity reaches zero and turns negative before position reaches its maximum.
A ball thrown upward is moving slowest just before its peak; its velocity crossed zero on the way up, before its height peaked. The same relationship governs any decelerating advance in price. RSI is a smoothed, bounded proxy for that velocity, so when an uptrend is losing steam — still rising, but more slowly — RSI's structure rolls over while price still makes weaker highs. That is the mechanical basis of negative reversals and bearish divergence: the structure leads because the derivative leads. The precise statement — that the momentum maximum occurs at an inflection point of price, which lies strictly before the price maximum — is proved in Appendix A.5.
This also disposes of the lazy objection that "RSI just lags price." A trailing moving average of price lags. A normalized derivative of price, read structurally, does the opposite at turns — the derivative of a decelerating move turns first. RSI does not predict the future; it reads the velocity of the present, which mathematically changes sign before the move does.
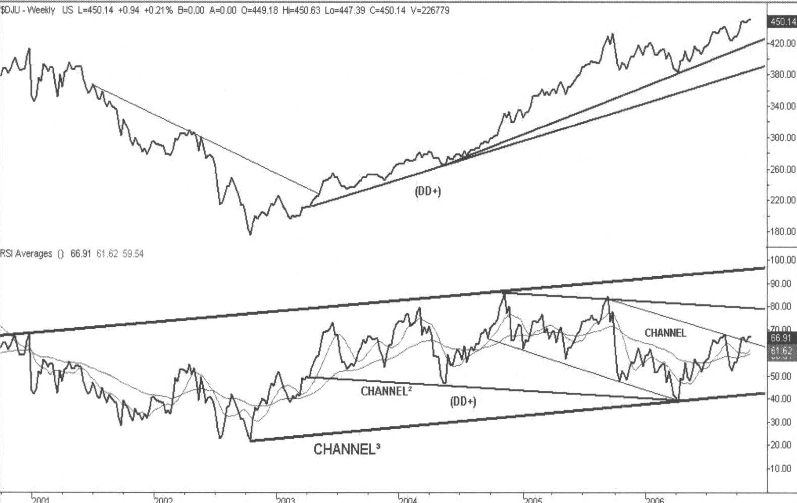
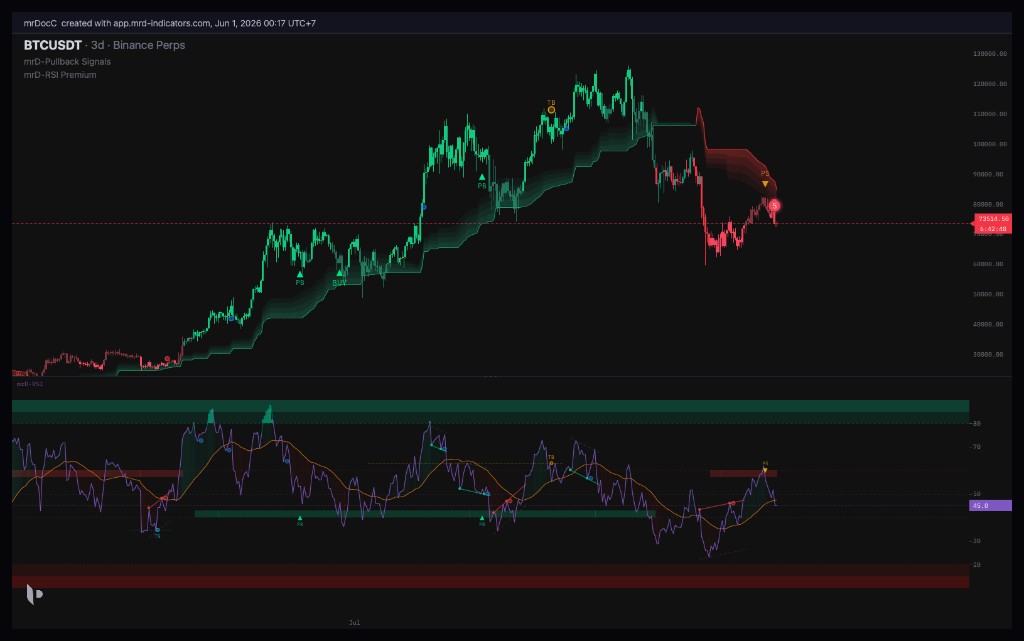 The leading property on a real chart: RSI's structural peak (the momentum maximum) sits to the left of the price peak. Price grinds to a marginally higher high on visibly weaker momentum — the empirical shadow of "the velocity maximum precedes the position maximum."
3.5 Baeyens: timeframe correlation and fractality
Walter J. Baeyens — a Cardwell-certified RSI analyst whose work extended the range rules into multi-timeframe, structural reading — is the clearest modern source for the idea that ties the whole structure dimension together: RSI behaviour is fractal, and the timeframes constrain one another.
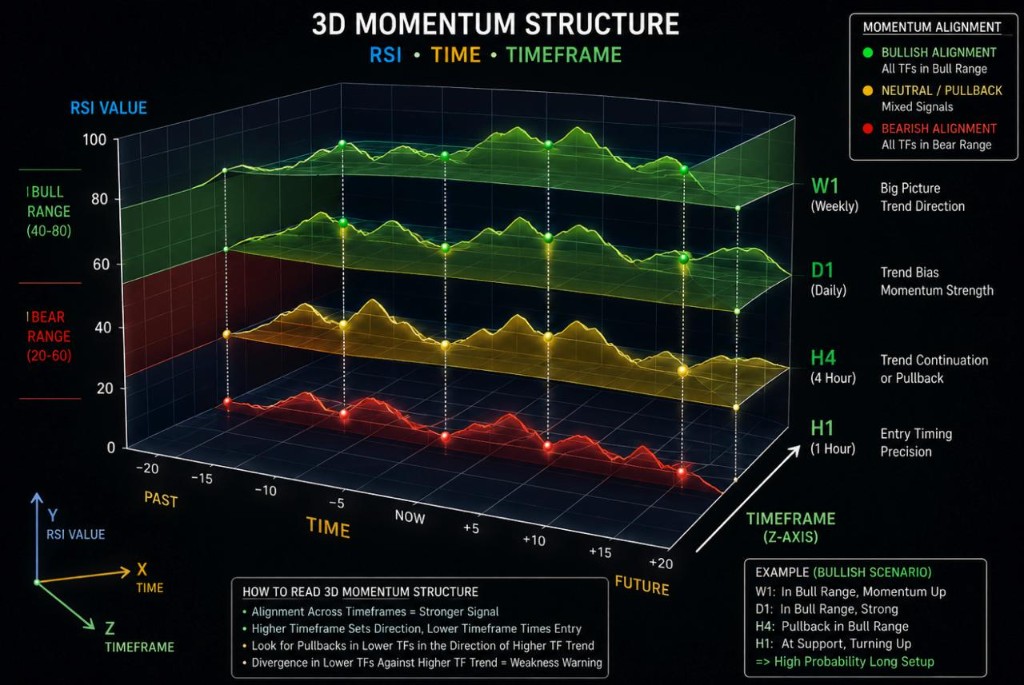 Momentum structure as a stack: the same RSI range rules read on W1, D1, H4 and H1 at once. The higher timeframe (W1/D1) sets the regime and direction; the lower timeframes (H4/H1) time the entry. When every layer sits in the same range the signal is aligned; when a lower layer diverges against the higher-timeframe trend, that is the weakness warning.
- The RSI range on a higher timeframe sets the context for any reading on a lower timeframe. A lower-TF extreme is only meaningful relative to where the higher-TF range sits.
- The same range-rule behaviour repeats at every scale: a 4-hour chart in a bull range contains 15-minute pullbacks that themselves obey the range rules in miniature.
- Therefore momentum structure nests. Reading several timeframes together — rather than one chart in isolation — is not an optional refinement; it is how you avoid trading a structure that the larger flow will overwhelm.
This is, concretely, what most traders are gesturing at when they say "RSI momentum structure": the shape of the RSI line and the way that shape correlates from one timeframe to the next.
The relationship between the timeframes is real but asymmetric. Most of the time the higher timeframe is in command — its regime nourishes the trend and the lower timeframes simply ride along. Occasionally the order inverts: when momentum on a lower timeframe turns decisively and sustains, that turn propagates upward and is what eventually relocates the higher-timeframe range (the range shift of §2.4). The diagram below names the two directions of flow.
 The two directions of timeframe correlation. Top-down (green): the higher-timeframe regime nourishes the trend and dominates roughly 90% of the time — this is why a lower-TF reading is only meaningful inside its higher-TF range. Bottom-up (red): on the ~10% of occasions when lower-TF momentum turns hard and holds, the reversal climbs the stack and eventually shifts the higher-TF range. Same idea as the range shift (§2.4), drawn as a flow.
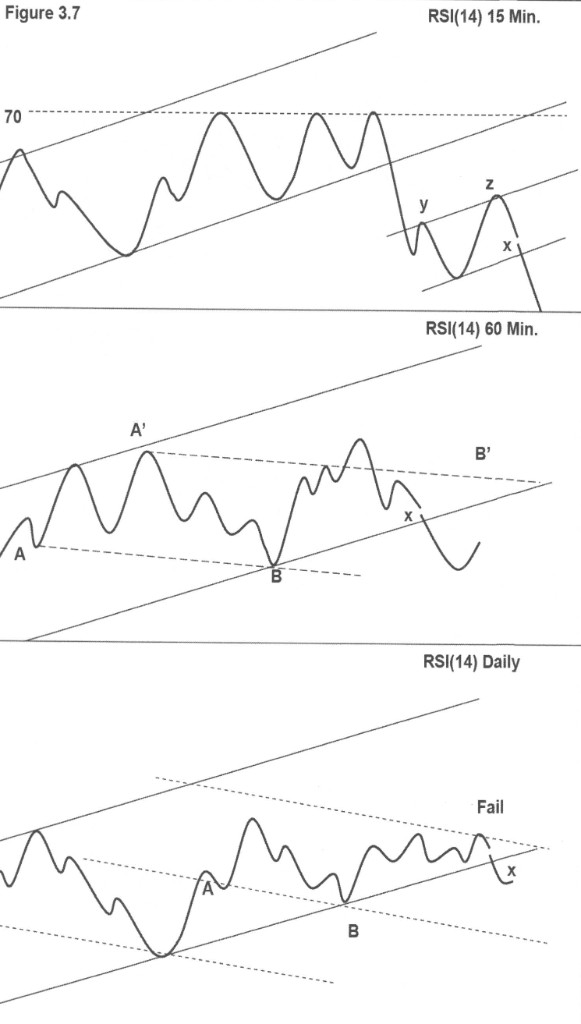 The same RSI(14) read on 15-minute, 60-minute and daily at once. The daily channel sets the regime; the 60-minute and 15-minute structures nest inside it and obey the same channel geometry in miniature. A lower-timeframe break (x) is only interpretable against the higher-timeframe channel it sits in. Chart: Walter J. Baeyens (multi-timeframe RSI study).
 Timeframe correlation, Baeyens-style: RSI confined to channels that nest across scale. The widest channel sets the regime; the channels inside it repeat the same range-rule geometry in miniature — which is why a lower-timeframe reading is only interpretable relative to the higher-timeframe band. Chart: Walter J. Baeyens (multi-timeframe RSI study).
Part IV — Value × structure: the unified read
Value and structure are two axes of one instrument. Read together, they classify the market into four states. This 2×2 is the most useful single table in the article:
| Structure supportive (reversal/continuation pattern with regime) | Structure deteriorating (RSI making opposing swings, trendline break) | |
|---|---|---|
| Value strong (holding bull range / above 50) | A: High-conviction continuation. Best entries live here — pullback into range support with a positive reversal. | B: Early warning. Strong level but decaying geometry — the regime-change candidate. Tighten, don't add. |
| Value weak (holding bear range / below 50) | C: High-conviction continuation (short side). Mirror of A. | D: Indecision / chop. Conflicting reads — the no-trade zone. |
The two states the static-threshold model is structurally blind to are B (strong value, decaying structure — the top that forms while RSI is "still overbought") and A/C (the continuation entries it would fade). That blindness is the whole cost of dropping the two dimensions.
A worked case study (uptrend)
Walk one full cycle on a hypothetical but typical uptrend, step by step:
- Establish the regime (value). Over the last several swings, RSI pullbacks have bottomed in the low-40s and turned up; rallies have pushed into the high-70s. RSI is holding above 50 on dips. Conclusion: bull regime. A dip toward RSI 45 is now a reload zone, not a sell.
- Wait for the pullback. Price retraces; RSI falls toward the low-40s range support. The static-threshold trader sees "RSI dropping" and does nothing useful with it. The value trader sees momentum returning to the exact zone where this trend has repeatedly resumed.
- Read the structure at support. On the pullback low, price prints a marginally lower low while RSI prints a higher low — a positive reversal (hidden bullish divergence). Momentum refused to confirm the price weakness.
- Combine (state A). Bull regime (value) plus a positive reversal at range support (structure) is the high-conviction continuation state. This is the "ride-the-wave" entry: the market has already proven its momentum, you enter on the pullback with the trend.
- Define invalidation. The structural invalidation is a decisive loss of range support — RSI breaking down through the low-40s floor and the 50-line, i.e. the start of a range shift (§2.4). That is a far more meaningful stop than "RSI hit some number."
- Manage with the value. As long as RSI keeps respecting range support on subsequent dips, the regime is intact and the runner stays on. The first dip that fails to hold support (state B → range shift) is the cue to harvest, not the first "overbought" print.
Now invert the warning case (state B): RSI is still printing high values (mid-70s) but the structure has started making lower highs and has broken its rising support trendline. Value says "still strong," structure says "decaying." That disagreement — high value, deteriorating structure — is exactly the pre-top condition a level-only reading cannot see, because the level is, by assumption, still "fine."
Part V — A practical protocol you can apply today
Theory you cannot execute is trivia. Here is a concrete routine that operationalizes everything above. It works on any market and any timeframe.
5.1 The six-step routine
- Classify the regime (value). Is RSI holding the bull range (pullbacks supported in the 40s, dips holding above 50) or the bear range (rallies capped in the 50s, below 50)? If neither — RSI drifting through 45–55 with no respected boundary — you are in chop; stand down.
- Locate the current reading within its range. At range support, at range resistance, or mid-range? Reactions matter at the boundaries, not in the middle.
- Read the structure at the boundary. Is there a reversal pattern (positive/negative reversal, or hidden divergence) forming where the value sits? Is the RSI trendline intact or breaking?
- Check timeframe correlation (Baeyens). Does the higher timeframe's regime agree with the setup? A lower-TF continuation entry inside an opposing higher-TF range is a trap — skip it.
- Place the setup in the 2×2. State A or C → tradable continuation. State B → manage existing risk, do not initiate. State D → no trade.
- Define invalidation as a value event, not a price guess. Your stop is "the regime is wrong" — a decisive break of range support/resistance and the 50-line — not an arbitrary distance.
5.2 Sizing by confluence, not by conviction
A disciplined way to size that follows directly from the framework:
- Full size: state A/C with higher-timeframe agreement and a clean reversal at the boundary. Everything aligns.
- Half size: state A/C on the working timeframe but higher-TF is neutral (not opposing). The edge is there but unconfirmed.
- No size: state B (warning), state D (chop), or any setup that the higher timeframe opposes.
Notice that none of these depend on "RSI hit 70." Every decision is a function of value relative to regime and structure relative to value.
5.3 What this protocol deliberately refuses to do
- It does not fade strength. Upper-band readings in a bull regime are continuation, not entries against the trend.
- It does not act on standalone divergence. A reversal pattern without a regime and a boundary is a bias, not a trade.
- It does not read one chart in isolation. Timeframe correlation is a required step, not a bonus.
Part VI — Applying value and structure at scale
Everything above is a single-chart discipline. The same framework, run mechanically across an entire market, is what powers the RSI tooling in the mrD-Indicators stack — applied to hundreds of pairs at once rather than one chart at a time. We mention it here not as a sales aside but because scale is the strongest possible test of a methodology: an idea that only works on one hand-picked chart is anecdote; an idea that survives being run continuously across 500+ markets is closer to a method.
- Futures RSI Heatmap — the value dimension at universe scale. Every tile is one of 500+ pairs, coloured by its current RSI bucket, with multiple timeframes stacked per tile. This is the bounded-normalized property of RSI (§2.6) turned into a market-wide regime map: one-colour clusters are risk-on/risk-off regimes; split clusters are rotations; a tile aligned across 15m, 1h and 4h is multi-timeframe value confluence — Baeyens' timeframe correlation, rendered for an entire universe at a glance.
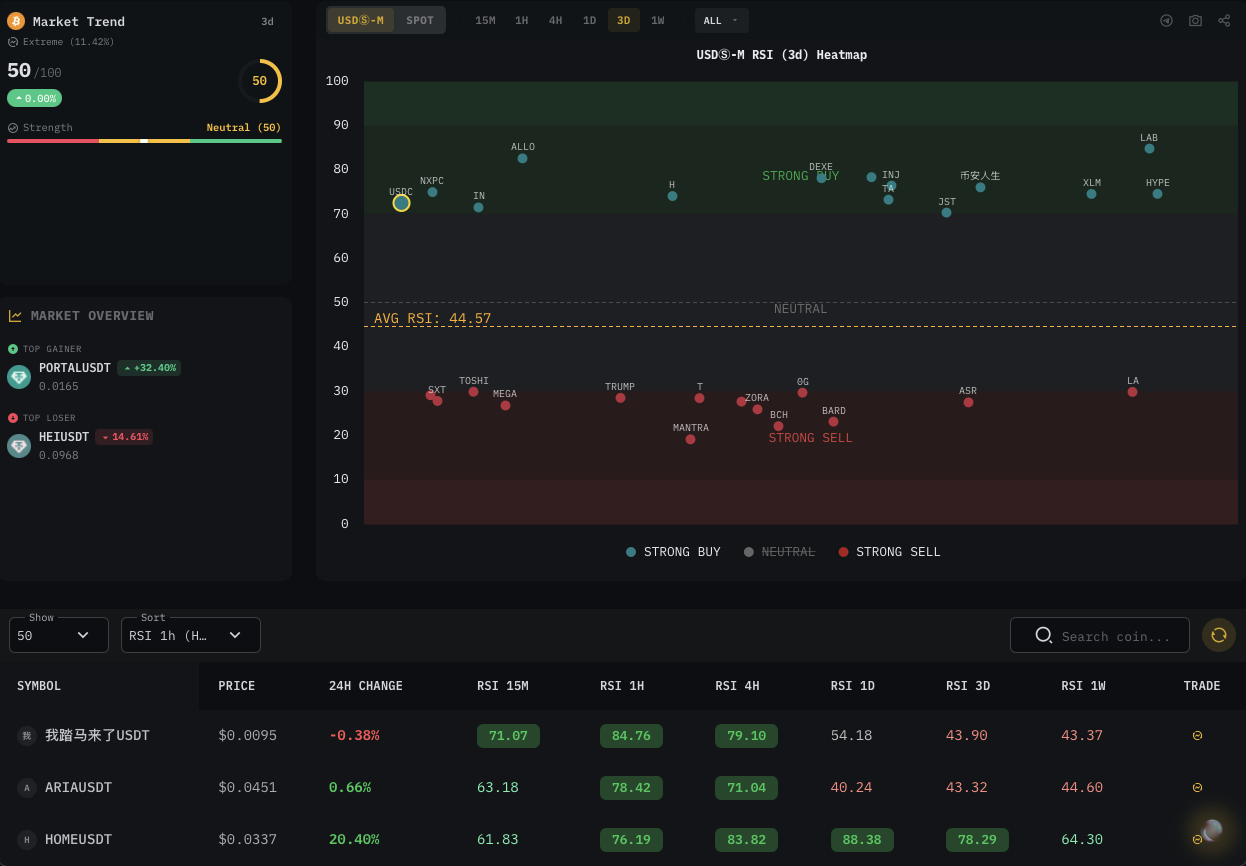 The cross-market comparability of §2.6 made operational: 500+ pairs on one screen, each tile a momentum-value reading on the same bounded scale. Colour clusters are regimes; divergent tiles are rotations — the value dimension scanned across the whole universe at once.
- Pullback RSI Signals — the ride-the-wave continuation entry from Part IV, streamed live across the universe. Rather than fading extremes, it surfaces the moment momentum proves itself and then pulls back into range support, with a strength score that folds in multi-timeframe agreement and confluence. It is state A/C, detected market-wide.
- mrD-RSI Premium — the full RSI-as-a-system study for the chart: a multi-timeframe RSI table, range-aware level zones, reversal/hidden-divergence reads, and pullback signals on a single panel. Its signal system is the value-and-structure framework operationalized — continuation entries, reversal traps, and a multi-timeframe confirmation mode for the highest-conviction setups.
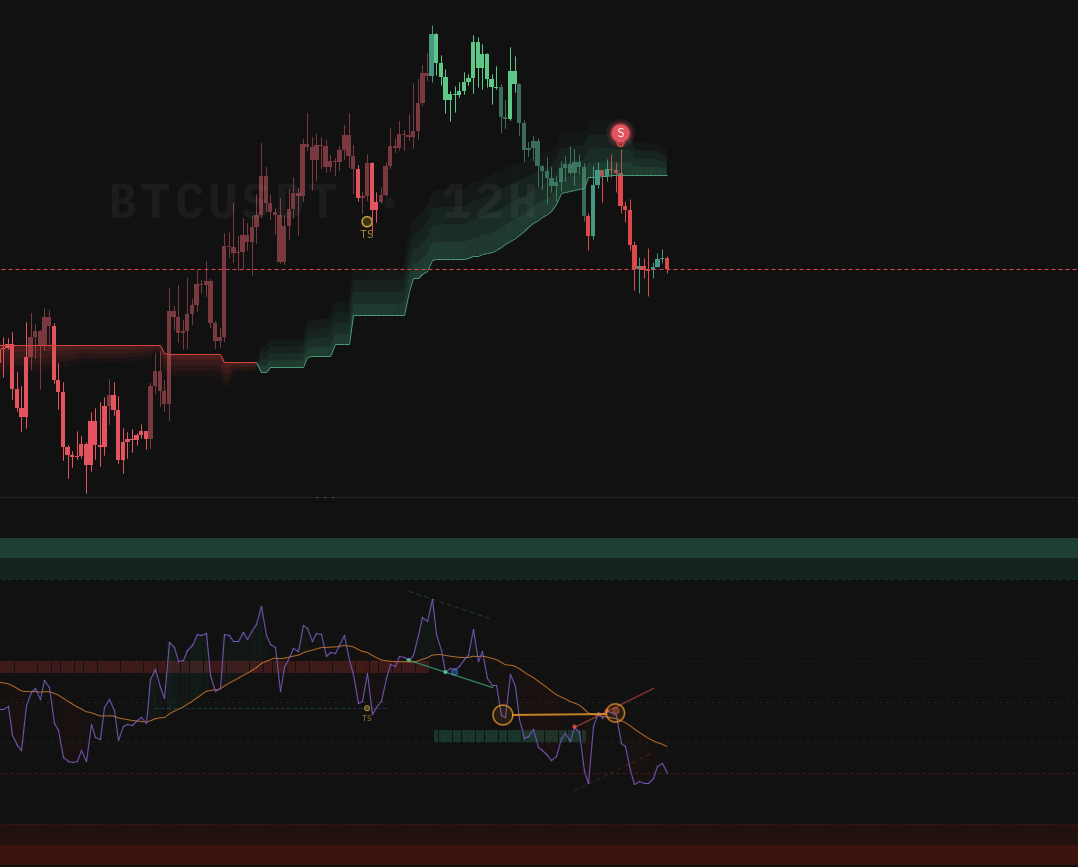
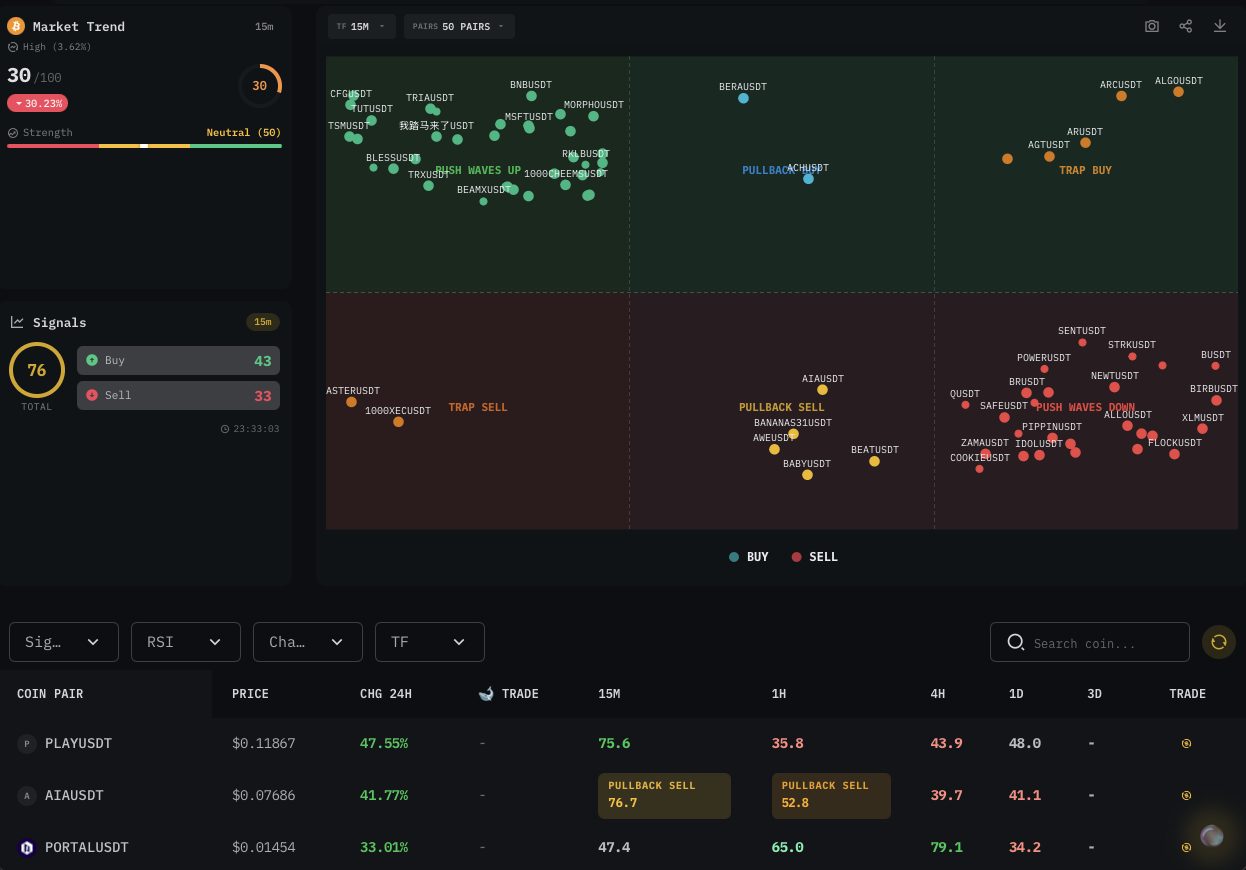 The value × structure read, productized: a continuation entry that only fires when the regime (value), the reversal (structure), and the higher-timeframe context all agree — state A of the 2×2, enforced mechanically.
For confirmation, pair the momentum read with structural price levels and order flow: momentum tells you when the timing is right; tools such as mrD-Smart Ranges and an orderbook heatmap tell you where the reactions happen.
Part VII — Limitations of the static-threshold model
The popular interpretation of RSI — fixed overbought/oversold thresholds at 70 and 30, traded as a mean-reversion signal — can be stated as a formal model and evaluated on its own terms. It is internally consistent and performs acceptably in range-bound markets. Its limitations are specific and, importantly, testable; each is addressed by the value-and-structure framework developed above.
- Scope. Fixed thresholds at 70/30 are the 1978 starting framework. Wilder's own work already included divergence and failure swings (§1.3) — structural reads outside the threshold model. The range rules (Cardwell), the measurement thesis (Hayden, 2004), and the multi-timeframe structural treatment (Baeyens) extend it; the static model is a special case, not the whole.
- Behaviour in trends. In a sustained trend the model misclassifies strength as exhaustion: RSI can hold the 70–90 band for the duration of an uptrend (§2.1, formalized by the saturation property in Appendix A.2). A model that reads persistent strength as a reversal condition is systematically wrong in trending regimes.
- Timing precision. Fixed thresholds provide no entry location beyond "an extreme was reached." The range rules supply regime-dependent locations — pullbacks into range support in a bull regime, rejections at range resistance in a bear regime — which are narrower and act earlier than a fixed level (§2.2, §2.5).
- The lead/lag question. The claim that a price-derived oscillator can only lag does not hold for a structurally read derivative: the maximum of velocity occurs at a price inflection point that strictly precedes the price extremum (Appendix A.5). Reading only the level discards this information; reading the structure recovers it.
- Cross-sectional comparability. Because RSI is bounded and normalized (Appendix A.1, A.4), readings are directly comparable across instruments and timeframes. The static model uses this only to flag single-chart extremes; the value dimension uses it to rank momentum across an entire market (Part VI).
These are empirical statements, and they are falsifiable. A direct test: over a representative sample of trends, measure (a) the proportion of upper-band RSI readings that preceded continuation rather than reversal, and (b) the frequency with which the RSI structure turned ahead of price at major highs and lows. The value-and-structure framework predicts both proportions are high; the static-threshold model predicts they are low. The measurement, not the interpretation, settles which model fits the data.
Common mistakes (even among people who know the range rules)
- Reading the level without first establishing the regime. "RSI is 68" is meaningless until you know whether the market is in a bull range (continuation) or a bear range (resistance). Classify the regime first, always.
- Drawing structure on one timeframe in isolation. A clean RSI trendline break on a 5-minute chart inside a higher-timeframe uptrend is usually noise. Structure must be read with timeframe correlation.
- Treating divergence as a trade by itself. A reversal/divergence is a structure read — a bias and a warning. It needs a regime (value) and a trigger before it becomes an entry. Standalone divergence in a long range fires constantly and mostly fails.
- Confusing continuation patterns with reversal patterns. Hidden divergence (continuation) and regular divergence (reversal) look similar and mean opposite things. Use the §3.3 table until it is automatic.
- Expecting precision the tool cannot give. RSI reports the state and structure of momentum. It does not see news, liquidity, or your position size. It is a high-quality input, not an oracle.
- Changing the period before understanding the default. The 14-period default is Wilder's, and the range rules were derived on it. Change it early and you are reading a different instrument than every source you are learning from.
Glossary
- Momentum — the rate of change (velocity) of price; the quantity RSI measures.
- Momentum value — the level of RSI, interpreted relative to the active regime (range).
- Momentum structure — the geometry of the RSI line: its swings, trendlines, support/resistance, and cross-timeframe correlation.
- Range rules — Cardwell's observation that RSI occupies ~40–80 in bull trends and ~20–60 in bear trends.
- Range shift — a regime change in which RSI's operating range relocates (bull → bear or vice versa).
- Positive / negative reversal — Cardwell's continuation patterns; the ancestors of hidden divergence.
- Regular vs hidden divergence — reversal vs continuation reads of RSI-vs-price disagreement (see §3.3).
- Timeframe correlation — Baeyens' principle that higher-timeframe RSI ranges constrain the meaning of lower-timeframe readings.
Frequently asked questions
Is RSI leading or lagging? Read as a level, coincident-to-lagging. Read structurally — as a normalized velocity whose turns precede price's turns — it leads at trend exhaustion. The leading property is real but specific: it appears in reversals and divergence, not in the raw level.
What RSI period should I use? Start with Wilder's default of 14, because the literature and the range rules were derived on it. Shorter is noisier; longer is slower. Change it only after you understand how the default behaves.
Does "overbought is strength" mean I should buy at RSI 80? No. It means RSI 80 in a confirmed bull range is continuation, not a sell. The entry is the pullback into range support, not the extreme.
Why does multi-timeframe matter so much? Because RSI's value is only meaningful relative to a regime, and the higher timeframe sets the regime for the lower one. The same lower-TF extreme means opposite things inside a higher-TF bull range versus a bear range.
How do I tell a range from a trend on RSI alone? In a trend, RSI respects one boundary and ignores the other (holds 40-support in bulls, rejects from 60-resistance in bears) and holds its side of the 50-line. In a range, it crosses 50 freely and reaches both extremes. The 50-line behaviour is the fastest tell.
Can this be automated? The detection can — regime classification, boundary location, reversal patterns, and timeframe agreement are all mechanizable, which is exactly what the tools in Part VI do across hundreds of pairs. The decision (size, context, whether to take the trade at all) remains yours.
Is any of this financial advice? No — see the disclaimer below. Value and structure are analytical lenses; they improve the quality of your read, not the certainty of any single trade.
Where to go from here
 The framework on the chart terminal: mrD-Pullback Signals and mrD-RSI Premium reading value and structure together — range zones, the multi-timeframe RSI, and pullback markers on one screen.
On the mrD-Indicators app
- Chart terminal (live) — open the full terminal and load mrD-RSI Premium and mrD-Pullback on any pair.
- RSI indicator — the RSI study on the chart terminal: range-aware level zones, the 50-line, and the multi-timeframe table.
- mrD-Pullback — the continuation/pullback layer that detects state A/C of the 2×2 (value × structure).
- Futures RSI Heatmap — the value dimension across 500+ pairs, with multi-timeframe stacking per tile.
- Pullback RSI Signals — live scanner — the value × structure continuation feed running across the whole universe in real time.
- mrD-RSI Premium and its Signal System — the full RSI-as-a-system study for the chart.
On TradingView
- RSI Swing v2 — Premium — RSI rendered as colour-zone values with a multi-timeframe table.
- RSI mrDoc — RSI with divergence and hidden-divergence reads; free to use.
Related reading
- How to Read an Orderbook Heatmap — pair the momentum read with resting-liquidity structure for confirmation.
The conclusion is straightforward: RSI is a momentum instrument with a value axis and a structure axis, and the fixed-threshold reading is a special case of it. Interpreted relative to its regime, drawn on the way price is drawn on, and evaluated across timeframes, the indicator functions as a momentum map rather than a fixed-threshold signal. Each claim in this article is stated so that it can be checked against data; that is the standard by which it should be judged.
Appendix A — Mathematical foundations
This appendix makes the claims in the body precise. None of it is required to use the framework, but it is what gives "momentum value and structure" the status of a derived result rather than an informal assertion. Notation: let U denote the Wilder-smoothed average gain and D the Wilder-smoothed average loss over the lookback n (default n = 14); gₜ ≥ 0 and ℓₜ ≥ 0 are the positive and negative parts of the bar-to-bar price change, so the signed change is gₜ − ℓₜ.
A.1 RSI is a logistic transform of the log gain/loss ratio
Start from the definition and simplify:
RSI = 100 − 100/(1 + RS),     RS = U / D

    = 100 · [ 1 − 1/(1 + U/D) ]
    = 100 · (U/D) / (1 + U/D)
    = 100 · U / (U + D)                         … (closed form)
Now set x = ln(U/D), the log ratio of average gains to average losses (a clean scalar measure of directional pressure). Then:
U/(U+D) = 1/(1 + D/U) = 1/(1 + e^(−x)) = σ(x)        (σ = logistic sigmoid)

⇒   RSI = 100 · σ(x),     x = ln(U/D)
Interpretation. RSI is a logistic compression of the log gain/loss ratio. It is bounded on (0, 100) by construction, symmetric about the equilibrium x = 0 ⇔ RSI = 50, and it is the same sigmoid family used throughout statistics — RSI is a probability-like reading (RSI/100 = σ(x) ∈ (0,1)) of "how one-sided has pressure been." This is the formal content of momentum value.
A.2 The sensitivity law — why RSI saturates at the extremes
Differentiate the sigmoid form. Using σ'(x) = σ(x)(1 − σ(x)):
dRSI/dx = 100 · σ'(x) = 100 · σ(x)(1 − σ(x))

        = RSI · (100 − RSI) / 100                  … (sensitivity law)
Evaluate it:
RSI =  50  →  dRSI/dx = 25     (maximum sensitivity)
RSI =  70  →  dRSI/dx = 21
RSI =  80  →  dRSI/dx = 16
RSI =  90  →  dRSI/dx =  9
RSI → 0 or 100 → dRSI/dx → 0   (saturation)
Interpretation. RSI is most responsive near 50 and increasingly insensitive near the extremes. The same change in underlying pressure (x) moves RSI far less at 85 than at 50. This is a rigorous, formula-level reason that RSI "rides" the upper/lower band in trends rather than snapping back — the high readings are mechanically sticky. It is also why fading a high RSI in a trend fails (§2.1): you are betting against a reading the math itself makes slow to fall.
A.3 Wilder smoothing as an EMA — geometric memory and half-life
Wilder smoothing is an exponential moving average with smoothing constant α = 1/n:
Uₜ = (1 − α)·Uₜ₋₁ + α·gₜ,     α = 1/n

Unrolled:   Uₜ = α · Σ_{k≥0} (1 − α)^k · gₜ₋ₖ
The weight on a bar k periods ago decays geometrically as (1 − 1/n)^k. Its half-life (how far back you go before a bar's weight halves) is:
(1 − 1/n)^h = 1/2  ⇒  h = ln(1/2) / ln(1 − 1/n) ≈ n · ln 2 ≈ 0.69 n

n = 14  ⇒  h ≈ 9.0 bars
Interpretation. RSI(14) carries roughly a 9-bar half-life of memory — recent enough to turn at trend exhaustion, smooth enough not to whip. Changing n changes this memory horizon, which is why the range rules (derived on n = 14) should be learned on the default before tuning (Common mistakes).
A.4 RSI as normalized momentum (net over gross)
From the closed form RSI = 100·U/(U+D), subtract the equilibrium:
RSI − 50 = 100·U/(U+D) − 50 = 50 · (U − D)/(U + D)

⇒   RSI = 50 + 50 · (net momentum) / (gross momentum)

      where   net   = U − D   (directional pressure, signed)
              gross = U + D   (total activity, ≥ |net|)
Since |U − D| ≤ U + D, the ratio (U−D)/(U+D) ∈ [−1, 1], so RSI is pinned to [0, 100] with 50 at perfect balance.
Interpretation. This is the exact sense in which RSI is normalized momentum: it is net directional pressure divided by gross activity, rescaled around 50. Because the denominator normalizes away the amount of activity, the result is comparable across instruments and timeframes regardless of volatility or price — the formal basis of the cross-market comparability in §2.6 and of any multi-asset RSI matrix (Part VI).
A.5 The leading property, proved
Let price P(t) be twice-differentiable (C²) near a local maximum at t*. Momentum is the velocity m(t) = P′(t). Two facts:
(1) At the price top t*:        P′(t*) = 0           (stationary point)
(2) Velocity m = P′ peaks where m′ = P″ = 0,
    i.e. at an inflection point t_infl of P.
During a decelerating advance into the top, P is concave (P″ < 0) on the interval (t_infl, t*), so on that interval m = P′ is strictly decreasing. Therefore the velocity attained its maximum at t_infl, and:
t_infl < t* ⇒ the momentum peak strictly precedes the price peak.
Interpretation. This is the rigorous statement of "momentum leads price." The lead is not luck and not curve-fitting — it is where the maximum of the first derivative sits relative to the maximum of the function. RSI, as a smoothed proxy of m(t), inherits the ordering (smoothing delays both turns by a similar lag, preserving the precedence for adequately separated extrema). Negative reversals and bearish divergence (§3.2–3.4) are the empirical shadow of t_infl < t*. The symmetric argument at a local minimum gives positive reversals and bullish divergence.
A.6 Timeframe correlation as approximate scale-invariance
Let log-returns over a sampling interval Δt be r_{Δt}. Many markets are approximately self-affine over a band of scales — i.e. the distributional shape of returns is roughly preserved under rescaling:
r_{λΔt} ≈ λ^H · r_{Δt} (H = Hurst exponent, scaling factor λ > 1)
RSI with period n integrates directional pressure over a real-time horizon ≈ nΔt (A.3). Two timeframes Δt₁ < Δt₂ with the same n therefore read momentum over horizons nΔt₁ < nΔt₂, and under approximate self-affinity the asymmetry structure that drives U versus D is scale-consistent. Consequently the range-rule behaviour (RSI confined to a band in a trend) recurs at every scale, and a lower-timeframe reading is only interpretable relative to the higher-timeframe band.
Interpretation. This is the formal skeleton of Baeyens' timeframe correlation (§3.5): momentum structure nests because the statistics that produce it are approximately scale-invariant. It is also why reading a single timeframe in isolation is unsafe (§5.1, step 4) — you are sampling one scale of a structure that lives across many.
References
- J. Welles Wilder Jr., New Concepts in Technical Trading Systems, Trend Research, 1978. (Original definition of RSI; divergence and failure swings.)
- Andrew Cardwell — RSI Range Rules, positive/negative reversals, and reversal-based price projection (Cardwell Financial Group; widely documented in the RSI literature).
- John Hayden, RSI: The Complete Guide, Traders Press, 2004. (RSI as momentum measurement; range shift.)
- Walter J. Baeyens — multi-timeframe and structural application of the RSI range rules (Cardwell-certified analyst; IFTA/MFTA material).
This article is education, not financial advice. Trading involves risk, and every momentum read can fail. The frameworks described are analytical lenses for interpreting a public indicator; they do not guarantee outcomes. Always test any method on your own data before risking capital.