Overview
mrD-RSI Premium is an advanced RSI toolkit with multi-layer pullback signals, bull/bear traps, hidden divergences, a multi-timeframe RSI table, and an Advanced Multi-Timeframe confirmation mode. Trader-first documentation — no code, just how to read and trade what you see on the chart.
mrD-RSI Premium is the RSI-as-a-system study in the mrD-Indicators stack. Standard RSI is a single oscillator line on a 0–100 panel; this study turns RSI into a complete read of the market: a multi-layer signal engine on top of the line (Pullback, Trap, Hidden Divergence, Pullback Advanced), a side-table that shows RSI across five timeframes at once, candle coloring on the price chart so you read RSI state without glancing twice, and a colour-banded panel layout that tells you at a glance whether you are in a bullish, bearish or undecided regime.
This is the overview for the study. Each of the four main feature areas has its own dedicated page linked from the list below. To install the study see Link your account & add the studies; for chrome and palette retune that should happen before any indicator is added, see TradingView Workspace Setup.
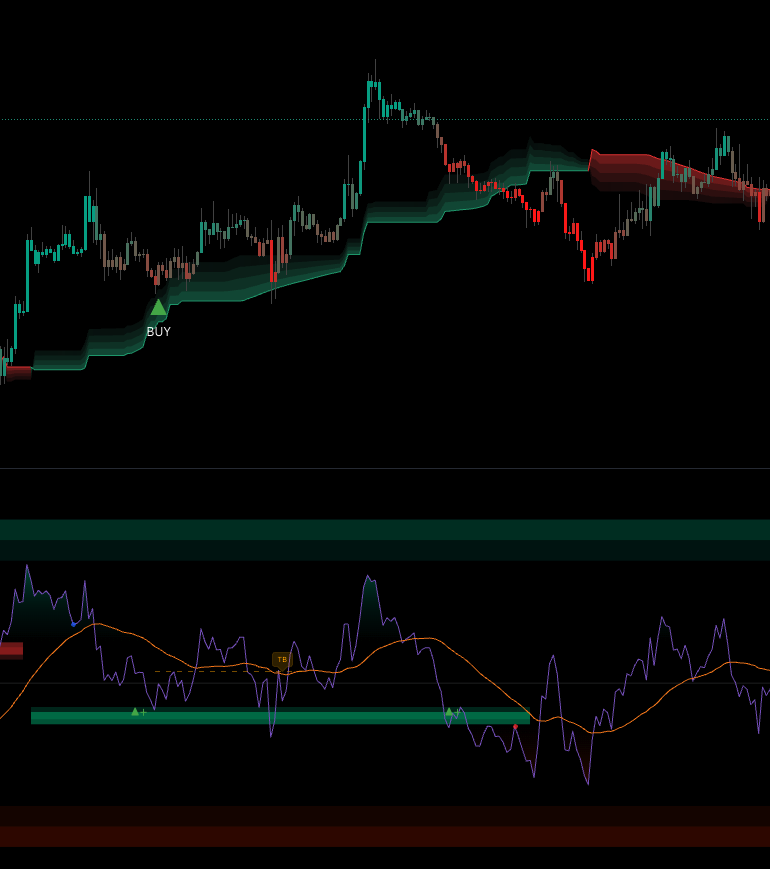 The full RSI panel. Purple line is RSI, orange line is WMA-45 (slow), the green band is the bull level (40–43), the red band is the bear level (57–60), and the side table shows RSI on 5 timeframes plus the projected price when RSI hits 80 / 20.
Who this study is for
mrD-RSI Premium is built for traders who already use RSI and want a stronger filter framework on top. The standard tool ships with one RSI line and two horizontal bands at 30 / 70; this study adds the signal engine, the multi-timeframe context, and the visual cues that turn the same indicator into a complete decision system.
Three trader profiles benefit from it:
- Day traders and scalpers — 15m–1H, looking for Pullback ▲+ / ▼− triggers, with the MTF table providing the cross-TF bias check in one glance.
- Swing traders — 4H–1D, looking for the rare Pullback Advanced (
BUY ADV/SELL ADV) setups that require multi-TF confirmation before firing — typically one A+ trade per week per symbol. - Reversal hunters — looking for Trap signals (TB / TS) that flag the moment a bull or bear trap snaps and the market reverses.
Not for:
- Traders who want a fully automated bot — the study is decision support, not auto-trade. Alerts can be wired to webhooks but you still design the strategy.
- Traders expecting 100% win rate — no indicator delivers that. Win rate scales with how strictly you filter.
The study works on every market: crypto, forex, indices, equities, commodities. RSI is universal; the signal engine on top of it does not depend on instrument-specific behaviour.
Quick start in three steps
The setup is intentionally minimal. Most users get value within the first day if they follow this sequence.
Step 1 — Keep the defaults on for the first week
The components most worth having are enabled out of the box:
- Multi-timeframe RSI table
- RSI-based candle coloring
- Overbought 80 / oversold 20 bands
- WMA-45 (the slow line on RSI)
- Bull level (40–43) and Bear level (57–60)
- Pullback signals (▲+ / ▼−)
- Trap signals (TB / TS)
Resist the urge to tweak anything for one full week. The study has its own "voice"; spend the first few days getting used to how it reads the market before you change defaults. Most setting changes that look like improvements after one day reverse themselves after one week.
Step 2 — Read the chart in the right order
Every time you open a new chart, follow this 30-second routine. It works for every market and every timeframe:
- Multi-TF RSI table (right side) — is the higher TF aligned with the chart TF? If yes, you have a directional bias. If no, you are in a counter-trend pullback or in chop.
- Candle color — bright = strong trend, dark = weak trend or transition. Multiple consecutive bright candles in one direction = the move has momentum.
- RSI position vs WMA-45 — above (bull bias), below (bear bias), or tangled (sideways)?
- OB / OS bands — is RSI sitting in an extreme zone (80+ or 20−)? Extremes mean "wait for the pullback signal", not "fade immediately".
- Signals — did anything fire on the last 1–3 closed bars? If yes, that is your candidate setup; if no, no trade is forced.
Step 3 — Be selective with entries
A short rulebook covers most beginner mistakes:
- Only enter when a Pullback or Trap signal aligns with the higher-TF bias from the MTF table.
- Never enter when RSI sits in the no-man's-land 40–60 and no signal has fired. That zone is structural indecision; the study is silent because there is nothing tradable.
- Wait for confirmation — at least one closed bar after the signal fires. The trigger bar is the signal; the next bar's behaviour confirms or invalidates it.
- Never use heavy leverage on a single pretty signal. Even an A+ Pullback Advanced fails some fraction of the time.
What is on the chart
The study renders three layers — the RSI panel, the price-chart overlay, and the side panel. Each is documented in detail on the dedicated pages, but a high-level legend lives here.
On the RSI panel
| Element | Meaning |
|---|---|
| Main RSI line (purple) | The standard 14-period RSI on chart timeframe. |
| EMA-9 (blue, optional) | Fast line on RSI — short-term momentum. Off by default. |
| WMA-45 (orange) | Slow line on RSI — acts as dynamic support / resistance for RSI itself. |
| Mid-line at 50 | The bull / bear divider. |
| Overbought 80 / Oversold 20 bands | The first level of extreme — fills colour when touched. |
| Extreme bands at 85/90 and 10/15 | The destruction zone — only appears in vertical moves. |
| Bull zone (40–43) | Turns green when RSI is in a bullish phase — primary buy-pullback zone. |
| Bear zone (57–60) | Turns red when RSI is in a bearish phase — primary sell-pullback zone. |
Full reference: Level Zones & Bands.
Signals on the RSI panel
| Symbol | Name | Direction |
|---|---|---|
| ▲+ green | Pullback Buy | LONG |
| ▼− red | Pullback Sell | SHORT |
| TB orange | Trap Buy — bulls trapped | SHORT |
| TS cyan | Trap Sell — bears trapped | LONG |
| Blue BUY box | Buy Hidden — pullback range from RSI peak down to 50 | LONG |
| Red SELL box | Sell Hidden — pullback range from RSI trough up to 50 | SHORT |
| BUY ADV / SELL ADV | Pullback Advanced — multi-TF confirmed | LONG / SHORT |
| Blue / red dots | Hidden divergence — bias confirmation only | Bias |
| Green / red 3D step | Visual highlight when a pullback signal fires inside a level zone — not a separate signal | — |
Full reference: Signal System.
On the price chart
- Candle coloring tied to RSI state — four tones: bright bull, weak bull, bright bear, weak bear.
- Optional triangle overlays for PB / PS / TB / TS mirrored from the RSI panel onto price candles, so you can keep your eye on price and still see signal events.
Side panel — the multi-timeframe RSI table
A 5-row table docked on the right side of the chart showing RSI across the current timeframe plus four higher timeframes, plus the projected price levels for RSI 80 and RSI 20 on the chart TF. The single most useful feature for cross-TF bias reads.
Full reference: Multi-Timeframe.
The full module index
| # | Page | What it covers |
|---|---|---|
| 1 | Signal System | The 7 signal types, their personality and frequency, the priority order when multiple signals stack, and the built-in filters the study runs silently. |
| 2 | Level Zones & Bands | RSI panel map top-to-bottom, the bull / bear level zones, OB / OS bands, extreme bands, the WMA-45 trend backbone, candle coloring, and the level-plus-signal combo grade. |
| 3 | Multi-Timeframe | The MTF RSI table, the auto-selected TF list per chart TF, the Advanced LTF mode, the recommended chart-TF / Advanced-TF pairings, the standard MTF workflow. |
| 4 | Alerts | The 8 alert modes, message format for each, setup by trading style (day / swing / reversal / divergence / pro), multi-symbol setup, webhook bot integration. |
Important warnings
A trading study is decision support, not an order. Every signal can fail. The points below are universal but worth repeating because they catch every new user once.
- No signal is correct 100% of the time. Your win rate is a function of how strictly you filter — the same signal with HTF alignment, level confluence, and confirmation has a much higher hit rate than the same signal taken in isolation.
- Higher timeframes → fewer but more reliable signals. A 4H Pullback Advanced is much more valuable than a 5m Pullback. If you find yourself overtrading, move up one TF.
- Lower timeframes → more signals but more noise. The logic still fires correctly at 1m / 5m but win rate drops because the underlying noise floor is higher.
- Never use heavy leverage on a single "pretty" signal. The study cannot see news, liquidity events, exchange downtime, or your account size. You can.
- Combine with price-zone analysis. Pair RSI signals with structural reads from mrD-Smart Ranges — RSI tells you when momentum is right, Smart Ranges tells you where the structural reactions happen.
Troubleshooting
Three things break first-time setups; fix them in order.
- MTF table not showing → enable
RSI Multi Timeframein the indicator settings (group: General Settings). - No signals firing → enable
RSI Pullback SignalsandRSI Trap Signals. Both are on by default — if they have been turned off they will silently produce nothing. - Advanced mode silent → make sure the timeframe picked in the Advanced settings is lower than the chart timeframe. Picking a higher TF disables the logic (and the MTF table prints a warning).
Where to go next
- The 7 signal types and how to read each one: Signal System.
- The panel anatomy and the level-plus-signal combo grade: Level Zones & Bands.
- The MTF table and the Advanced LTF mode: Multi-Timeframe.
- Wiring alerts into push / webhook / auto-trade: Alerts.
- Pair with structural reads: mrD-Smart Ranges.
- Pair with the composite signal engine: mrD-Signals Premium.