Overview
mrD-Smart Ranges is the Smart Money Concept TradingView study at the structural layer of the mrD-Indicators stack — it maps Order Blocks, Fair Value Gaps, Liquidity zones, and the retest-based BUY/SELL signals that fire when price comes back into those zones. Full module index, recommended workflow, and where each concept fits in a trade.
mrD-Smart Ranges is the structural study in the mrD-Indicators stack. It does not try to call the turn directly — it builds the map traders use to place orders: where institutional supply / demand was last printed (Order Blocks), where price moved too fast and left an unfilled gap (Fair Value Gaps), and where the market is parked stop-losses for the next sweep (Liquidity zones). When price returns to one of those zones, the study fires a BUY / SELL retest signal that you can act on directly or pair with one of the momentum studies for confirmation.
This is the overview for the study. Each of the five modules has its own dedicated settings page linked from the list below. To install the study see Link your account & add the studies; for chrome and palette retune that should happen before any indicator is added, see TradingView Workspace Setup.
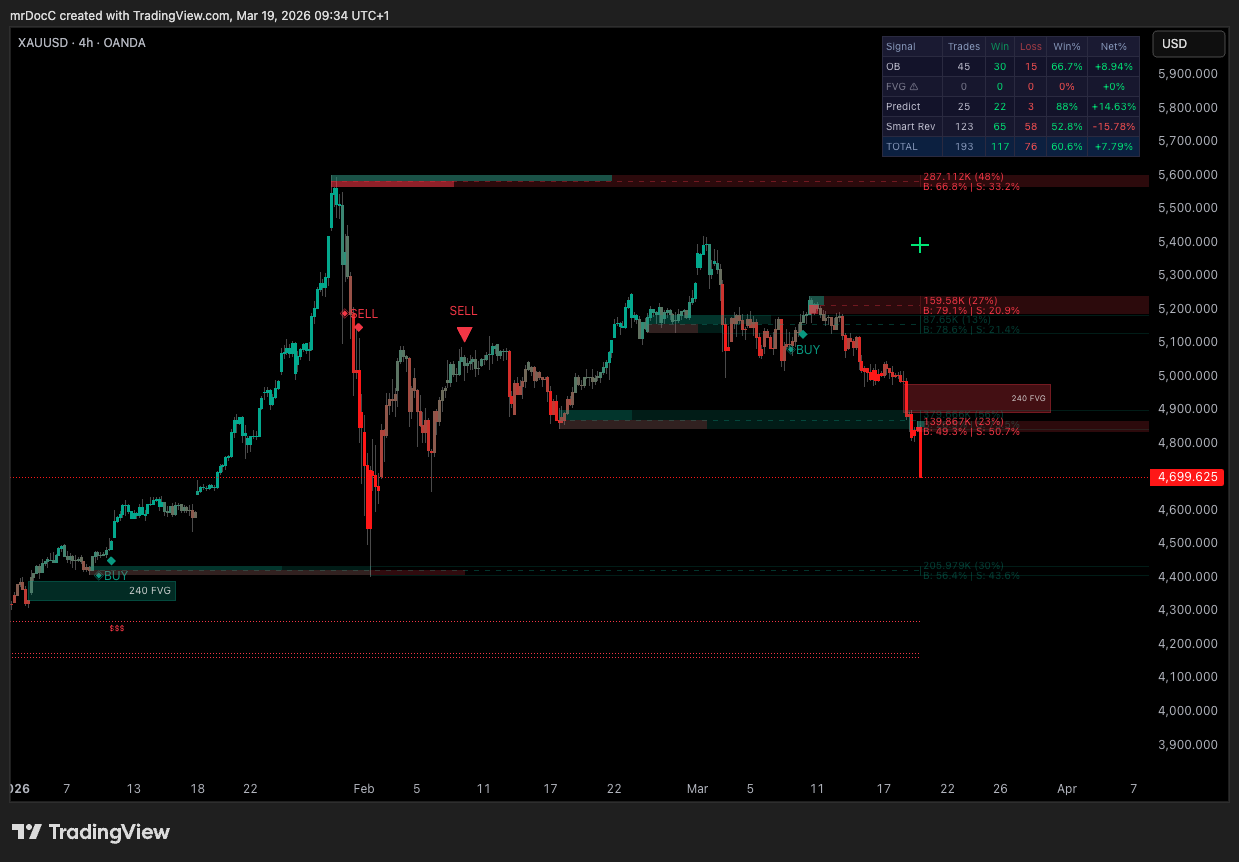 Order Blocks are the cyan / red rectangles, FVGs are the lighter shaded strips between candles, and the horizontal lines are the buy-side / sell-side liquidity levels. When price retests one of these zones and the model agrees, a triangle prints.
The script is published at https://www.tradingview.com/script/M267ZUYT-mrD-Smart-Ranges/. Access is invite-only — see the access flow on Link your account & add the studies.
Who this study is for
The study is built for traders working with Smart Money Concept style structural reads — order flow, supply/demand, ICT-style imbalance, liquidity sweeps. If you trade purely on indicators (RSI, MACD, moving-average crosses) you will get value from the BUY/SELL signals but you will miss the larger picture the study is mapping. The four core concepts — OB, FVG, BSL/SSL, and retest signals — are reinforcing layers, and the trades that work consistently are the ones where two or more layers align at the same price.
Three trader profiles benefit from it:
- Day traders and scalpers on 5m–1H — looking for the H4 OB retest on M15, or the M30 FVG fill on M5.
- Swing traders on 1H–4H — looking for the H4 / D1 OB confluence, with the D1 liquidity sweep as the macro trigger.
- Position traders on 1D–1W — looking for the weekly OB to mark the macro pivot zone, with FVGs flagging short-term continuation.
Lower timeframes (1m) are technically supported but the OB / FVG density becomes noisy; the recommended floor is 5m and the recommended sweet spot is 15m–4H.
The four structural concepts
mrD-Smart Ranges plots four conceptually-distinct layers on the same chart. Understanding which layer is firing — and which two layers are aligning — is the whole trading edge.
Order Blocks — the institutional footprint
An Order Block is the last opposite-coloured candle before a strong, impulsive move. The idea: institutional desks fill large orders across a range of price levels before pushing the market; that absorption zone is "where they got positioned", and price tends to return to it before continuing. mrD-Smart Ranges auto-detects these zones, ranks them by relative order volume, lets you display only the strongest ones (highest %), and offers three mitigation modes (Wick / Close / Average) that change how the zone is bounded.
→ Full reference: Order Blocks
Imbalance / Fair Value Gaps — unfilled price
A Fair Value Gap is a three-candle pattern where the wick of candle 1 and the wick of candle 3 do not overlap — leaving an unfilled price strip in the middle of candle 2. The market moved too fast for both sides to transact at those prices. FVGs tend to magnetise price back; the model fires a small •BUY / •SELL arrow when a matured FVG is retested.
→ Full reference: Imbalance Concept
Liquidity — where stops are parked
Liquidity zones are clusters of stop-loss orders. Buy-Side Liquidity (BSL) sits above swing highs — that is where short traders parked their stops; running it triggers a wave of buy-stop orders. Sell-Side Liquidity (SSL) sits below swing lows — long traders' stops; running it triggers a wave of sell-stop orders. The study draws BSL / SSL lines and highlights the zone in green when price enters, so you can see the sweep happen in real time.
The market does one of two things at the liquidity sweep: reverses (the classic sweep-and-reverse — institutions ran the stops to fill, then push back the other way) or continues (a clean break in the direction of the prevailing trend). Reading which one is unfolding is the central skill of liquidity-based trading.
→ Full reference: Liquidity Concept
Retest signals — the BUY / SELL triangle
The signal layer ties the three structural layers together. The study fires:
- OB Signal — a large
BUY/SELLtriangle when price retests an Order Block Breaker (a previously-broken OB that is acting as new support / resistance). - FVG Signal — a small
•BUY/•SELLarrow when price retests a matured Fair Value Gap.
The signals are non-repainting — they print on bar close and do not move once the candle has closed. Both can be wired through TradingView's alert infrastructure into push, email, webhook (auto-trade bots, Telegram, Discord).
→ Full reference: Alerts
The full module index
| # | Page | What it covers |
|---|---|---|
| 1 | General Settings | Display theme (Dark / Light / Monochrome) and metrics text size — chrome-only. |
| 2 | Order Blocks | The OB engine — Volumetric Order Blocks, Mitigation Type, HTF confluence, Order Block Break / retest. |
| 3 | Imbalance Concept | Fair Value Gaps — FVG Filters, FVG Signals, mitigation, HTF, FVG Extend maturity. |
| 4 | Liquidity Concept | Buy-Side / Sell-Side Liquidity detection and the reversal-vs-continuation read. |
| 5 | Alerts | OB and FVG alert wiring, message format, webhook setup, direction filter. |
Recommended workflow
A canonical Smart-Ranges trade is built in three steps:
- Identify the zone — look at the chart with
Order BlocksandFVG Filtersboth ON. Use theShow Lastsetting to keep the chart readable (10–20 OBs is usually enough). Turn onHigh Timeframefor the OB engine so the strongest zones — the ones that overlap a higher-TF OB — are highlighted. - Wait for the sweep / retest — let price come back into the zone. If the zone is an OB Breaker, you are watching for the BUY / SELL triangle. If the zone is an FVG, you are watching for the
•BUY/•SELLarrow. If you can see a BSL or SSL line just inside the zone, expect a brief sweep before the reaction. - Confirm with another layer — the highest-conviction setups are when the OB and the FVG align at the same price, or when the OB sits right on a liquidity sweep. Single-layer trades work in trending markets but lose edge in chop; double-layer trades survive both.
Pair Smart Ranges with one of the momentum studies for an extra confirmation gate:
- mrD-Signals Premium — pair the OB retest with a Waves Trend triangle in the same direction for a much higher-confidence entry.
- Open Interest — pair the liquidity sweep with a fresh open-interest spike to confirm new money is committing rather than longs unwinding.
Recommended baseline settings
If you have just added the study and want a clean starting point, set the inputs as follows:
| Module | Setting | Suggested value | Why |
|---|---|---|---|
| Order Blocks | Show Last | 20 | Keeps the chart readable. |
| Order Blocks | Mitigation Type | Wick | Most conservative; OB invalidates only when the entire candle penetrates. |
| Order Blocks | High Timeframe | One step up from chart TF | Highlights confluence zones (the strongest OBs). |
| Order Blocks | Show Metrics | On | Surface the % weight so you can sort by importance at a glance. |
| Order Blocks | Order Block Signals | On | The main BUY / SELL triangle engine. |
| Order Blocks | Order Blocks Break | On | Show the breaker zones — these often become the next retest. |
| Imbalance | FVG Filters | On | Required to render FVGs at all. |
| Imbalance | FVG Signals | On | Required to receive •BUY / •SELL arrows. |
| Imbalance | Mitigation Type | Wick | Conservative — FVG invalidates only when wick fully fills. |
| Imbalance | FVG Extend | 50 | Default. Lower = more FVG signals; higher = stricter maturity. |
| Liquidity | Liquidity Detect | On | Highlights the green zone the moment a sweep starts. |
| Liquidity | Lines | On | Draw the BSL / SSL horizontals so you see the levels before price gets there. |
| General | Themes Display | Dark | Matches the recommended chart palette in Workspace Setup. |
| General | Metrics Text Size | Auto / matches screen DPI | Tune up on 4K, down on laptop. |
Common mistakes
- Showing every OB the engine can detect. The chart becomes unreadable above ~40 OBs. Use
Show Lastto cap the count and let the engine drop the lowest-weight zones first. - Trading single-layer setups in chop. An OB retest with no FVG / liquidity / momentum confluence is a low-quality entry in a sideways market. Wait for two layers to align, or skip the setup.
- Ignoring the Mitigation Type difference. Switching from
WicktoClosechanges how soon an OB is "invalidated" —Wickkeeps zones live longer,Closediscards them faster. Pick once, stay consistent. - Trying to react to the OB retest at 1m or 3m. Those timeframes have too much noise — the OB will be sliced ten times before the real reaction. Stay at 5m floor.
- Forgetting that FVG Signals also need FVG Filters ON. Two separate toggles in the same panel; turning Signals on without Filters returns nothing. See Alerts for the exact dependency.
Common questions
Is mrD-Smart Ranges a strategy by itself? It is closer to a structural framework than a strategy. The BUY / SELL retest triangles are entries; the sizing, stop placement, and exit are still on the trader. The study suggests SL / TP levels inside the alert message — those are suggestions derived from the OB / FVG geometry, not orders the study places.
Does it repaint? No. OBs are confirmed on the close of the move that creates them; FVGs are confirmed once the three-candle pattern completes. The BUY / SELL retest signals are confirmed on bar close. Nothing moves backwards once printed.
Does it work on every symbol / timeframe? Yes. The four concepts are timeframe-agnostic. In practice the sweet spot is 5m–4H on liquid majors (BTC, ETH, top-cap futures, S&P 500 futures, EURUSD). Very low-liquidity altcoins produce too many low-weight OBs to be useful.
Can I use it without TradingView alerts? Yes — the chart visuals are the primary delivery. Alerts are optional; they exist for traders who want push / webhook delivery.
Where to go next
- The study chrome and per-module settings: start at General Settings.
- The OB engine that drives the primary BUY / SELL triangle: Order Blocks.
- The FVG layer that adds the
•BUY/•SELLarrow: Imbalance Concept. - The BSL / SSL layer that explains the sweeps: Liquidity Concept.
- Wiring alerts into push / webhook / auto-trade: Alerts.
- The platform-level alert mechanics, frequency, plan limits, webhook security: TradingView Alerts.