Trading with CVD Profile: A Practical Guide
How to read a CVD Profile and trade four repeatable setups — trapped traders, distribution top, accumulation bottom, and absorption resolution — with clear entry rules.
If a candle closes green at a key level, you still do not know who closed it. Was it real demand, or was it sellers absorbing? Volume Profile tells you how much traded at each price. CVD Profile tells you which side was in control at each price. That one extra dimension is the entire reason this indicator exists.
This guide is the trader's manual. No math, no payloads — just how to read the profile in ten seconds, the four patterns worth trading, the multi-session signals that actually print money, and the pre-trade checklist you can run on every setup.
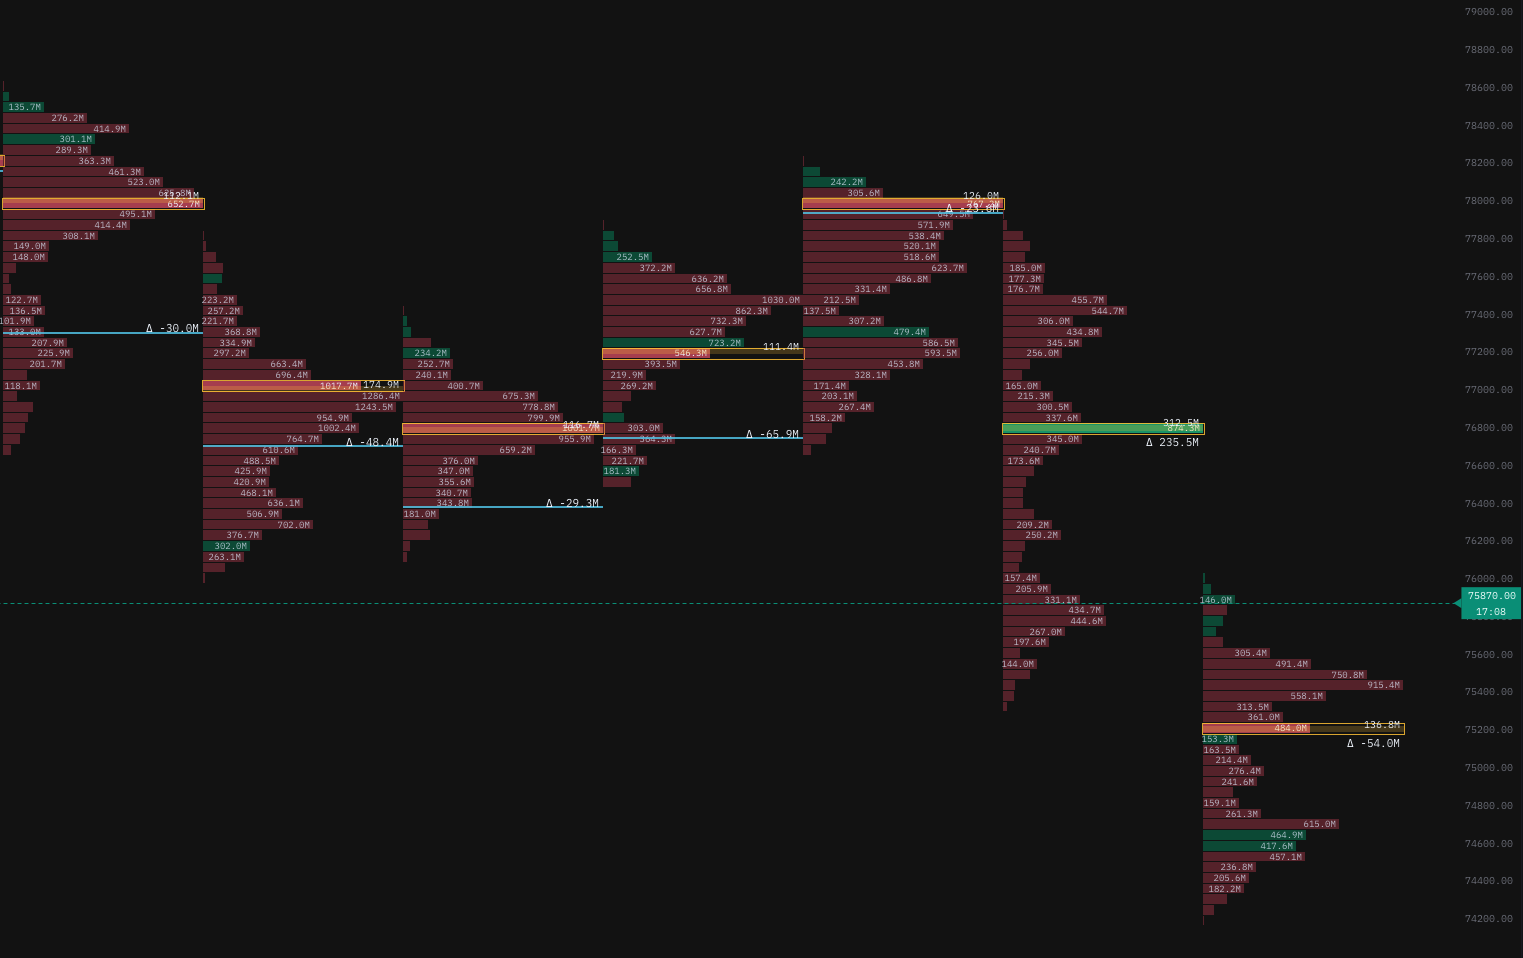 A CVD Profile next to price. Each row shows buy volume (taker-buys lifting the ask) versus sell volume (taker-sells hitting the bid) for that price level over the session — the signed footprint of who was in control where.
New to order flow? Start with the Depth Heatmap Complete Guide for the resting-liquidity view and the Footprint Chart Complete Guide for intrabar aggressor flow. CVD Profile is the third leg of the same triangle — it shows cumulative aggressor flow at each price across a whole session.
What CVD Profile actually is
CVD Profile (Cumulative Volume Delta Profile) is a vertical histogram plotted next to the price chart. At each price level inside a session it shows three numbers:
- Buy volume — quantity traded by aggressive buyers (market orders lifting the ask).
- Sell volume — quantity traded by aggressive sellers (market orders hitting the bid).
- Delta —
buy − sell, signed.
It is not Volume Profile with extra colour. Volume Profile shows total quantity per price; CVD Profile shows the signed breakdown — which side was in control at each row. The difference between "$50,000 traded 1,000 BTC" and "$50,000 traded 700 buys and 300 sells" is the difference between a level that holds and a level that breaks.
A session can be any window: 1h, 4h, 1d, or 1w. Pick a session that is larger than the timeframe you trade. Scalpers use the 1h and 4h profiles. Swing traders use the 1d and 1w. Multi-timeframe confluence — see the section near the end — is where the strongest setups live.
For the full indicator spec (settings, futures-vs-spot mode, divergence rules), see the CVD indicator docs.
How to read the profile in 10 seconds
Three things to scan, in order. Skip any of them and you are guessing.
1. Where is the POC (Point of Control)?
The POC is the price with the highest total volume in the session. It is a magnet — price tends to return to it. But the POC alone is incomplete data. Step two is mandatory.
2. Is the POC buy-driven or sell-driven?
Check the delta share at POC: (buy − sell) / (buy + sell).
- Strong positive (buyers dominate) → POC will act as support on retests.
- Strong negative (sellers dominate) → POC will act as resistance on retests.
- Near zero → POC is an absorption block. Two-way fight, no clear winner yet. The winner reveals itself when price escapes the block.
3. What is the session total delta versus the session price direction?
This is the master signal. Four possible combinations:
| Session delta | Session close | Reading |
|---|---|---|
| Strongly positive | Price up | Genuine bullish — trend with flow |
| Strongly positive | Price flat or down | Hidden distribution — buyers absorbed by silent sellers. Reversal setup. |
| Strongly negative | Price down | Genuine bearish — trend with flow |
| Strongly negative | Price flat or up | Hidden accumulation — sellers absorbed by silent buyers. Reversal setup. |
The two "hidden" rows are where most of the alpha lives. Price action alone never reveals them. Volume Profile never reveals them. Only signed flow does. This is the single most important table in the article — internalise it.
The four patterns worth trading
Out of all possible profile shapes, four recur often enough and resolve consistently enough to build setups around. Memorise these.
Pattern 1 — Trapped traders
A previous session shows a tall green cluster at price X — buyers were highly aggressive there. Price has since drifted away from X by ≥ 0.5%. Those buyers are now offside.
The next time price retests X, the offside buyers will exit at breakeven. That exit is selling pressure. X becomes resistance on the retest from below — or support, if the cluster was red and the offside side is short.
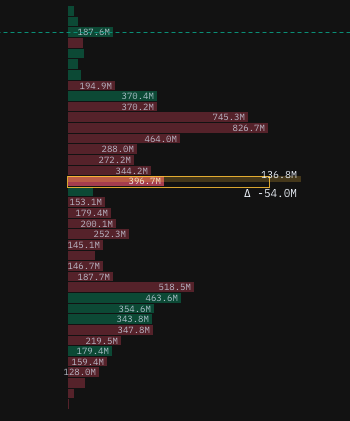 A trapped-long cluster on the prior session. Buyers were aggressive at the marked level; price has since slipped below. On the first retest from below, the trapped longs exit at breakeven and turn the cluster into resistance.
Trade: fade the retest. Entry at the edge of the cluster, stop just past the far edge, target the previous POC or the next thin spot.
Filter: before entering, check the last 3–5 candles of 5m flow. If flow is already opposing the trapped side, the unwind has started and the entry is live. If flow is still in the trapped side's favour, wait — they have not capitulated yet.
Pattern 2 — Distribution top
Session total delta is strongly negative, but price closes near the session high. There is a red cluster near the top of the session range — sellers were aggressive at the highs while retail bought into them.
When the smart-money supply finally exceeds retail demand, price breaks the session low. That break is the confirmation.
Trade: two options.
- Conservative: short when price closes below the session low on the next 1h candle.
- Aggressive: short the retest of the session high when it prints a rejection candle.
Stop just above the session high. Target the POC of the prior session, or the next significant volume cluster below.
Pattern 3 — Accumulation bottom
Mirror of Pattern 2. Session total delta strongly positive, price closes near the session low, green cluster at the bottom of the range.
Trade: long on the break above the session high (conservative) or long on a successful retest of the session low (aggressive). Stop below the session low. Target the next overhead cluster.
Pattern 4 — Absorption resolution
A specific price range shows the highest volume of the session, but the delta there is near zero — both sides traded heavily without anyone winning. Price chops sideways inside the band for an extended period.
Eventually one side runs out. The break out of the absorption band is usually fast, because the losing side has no inventory left to defend with.
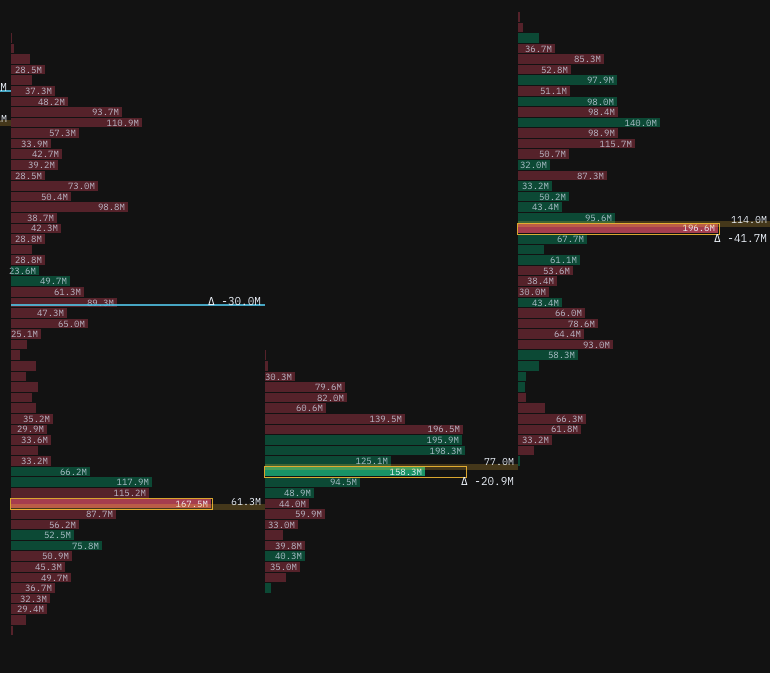 An absorption block — the highest-volume cluster of the session prints near-zero delta. Both sides committed heavily; neither won. Price chops inside the band until one side runs out of inventory, then the break is fast.
Trade: do not enter inside the band. You will get chopped. Wait for price to close outside the band with flow confirming the break — meaning the breakout candle itself has strong directional delta. Then enter, with stop placed back inside the band's midpoint.
Targets tend to be generous because price moves through the thin spots above and below the band quickly.
Multi-session reading — the cumulative curve
A single session is one snapshot. The real edge comes from chaining sessions together via the cumulative delta curve. Three multi-session patterns matter.
Trend confirmation. Cumulative delta rising and price rising → genuine bull trend, flow supports it, pullbacks are buys.
Bearish regular divergence. Price prints higher highs over several sessions; cumulative delta prints lower highs. Aggression is fading even as price holds up. The next move is down.
Bullish regular divergence. Mirror — price lower lows, cumulative higher lows. Capitulation selling is fading. The next move is up.
These divergences are the strongest reversal signals CVD gives. They are not visible on price-only charts and they are not visible on Volume Profile. Wait for confirmation — a 5m candle close in the divergence direction — before entering.
Regime flip. When the cumulative delta on a rolling 4h window flips sign — from net positive to net negative or vice versa — the underlying bias of the market has changed. Every existing setup needs to be re-evaluated. Pro-trend setups in the old direction become counter-trend setups. Close stale positions or reduce size.
Three setups you can trade this week
Concrete, repeatable, no story required.
Setup A — Trapped long retest (short)
Setup criteria:
- Pull up the 1h or 4h CVD Profile from the last few sessions.
- Find a green cluster (heavy buy volume, buy share ≥ 60%) that is now ≥ 0.5% above current price.
- That cluster has not been retested yet (first touch).
Entry trigger:
- Price retests the cluster from below.
- On the 5m chart, the candle hitting the cluster prints an upper wick and closes red.
- Last 3 candles of 5m flow are net sellers.
Plan:
- Entry: at the lower edge of the cluster.
- Stop: 1 tick above the cluster's upper edge.
- Target 1: 50% of the drift back to current price (close 50%).
- Target 2: prior session POC.
- Risk-to-reward: minimum 2:1. Typically 3:1 to 5:1 on this setup.
Setup B — Distribution reversal (short swing)
Setup criteria:
- 1d CVD Profile of the prior session.
- Session delta deeply negative (≥ 10% of total session volume).
- Session close in the top 25% of the session range.
- Red cluster in the top 25% of the range with strong sell dominance (sell share ≥ 65%).
Entry trigger:
- Price breaks below the session low on a 1h candle close, or
- Price retests the session high and prints a rejection candle.
Plan:
- Entry: at the trigger price.
- Stop: above the session high + small buffer (~0.1–0.2%).
- Target 1: prior session POC.
- Target 2: next thin spot or major support.
- Risk-to-reward: typically 2:1 to 4:1.
Mirror this for Setup B-long: accumulation bottom on the daily, long on break above session high.
Setup C — Absorption breakout
Setup criteria:
- 4h CVD Profile.
- A price band with very high volume and near-zero delta — the absorption block.
- Price has chopped sideways in or near the band for at least one full session.
Entry trigger:
- Price closes outside the band on a 5m candle.
- The breakout candle itself has strong directional delta (≥ 30% share toward the break direction).
- The next 1–2 candles confirm — no immediate reversal back into the band.
Plan:
- Entry: at the close of the confirmation candle (or pullback to the band edge).
- Stop: back to the midpoint of the absorption band.
- Target: the next significant volume cluster in the breakout direction. Thin spots in between mean the move is usually fast.
- Risk-to-reward: typically 3:1 to 6:1 because of the thin air above and below the band.
Multi-timeframe confluence
A single anchor is incomplete. Use at least two:
- Smaller anchor (1h or 4h) for timing.
- Larger anchor (1d or 1w) for bias.
The strongest setups occur when both anchors agree:
- Daily profile shows distribution at the highs (bearish bias).
- 1h profile shows a fresh trapped-long cluster on the current pullback rally.
- Cumulative delta on the 4h window is rolling over.
Three independent CVD signals pointing the same way is a high-conviction setup. Single-anchor signals are tradeable but with reduced size.
Outside confluence — liquidation heatmap, funding rate, open interest, or the orderbook heatmap patterns — adds further weight but is not required when internal CVD confluence is already strong.
When not to trade
The most underrated skill. Sit out when:
The session is still open. Profile shape can flip 180° before the close. Decisions are made on closed sessions only. The live session is for monitoring, not entries.
Total delta is near zero with no clear cluster bias. No story, no edge. Anything traded here is a coin flip.
The zone has been tested 3+ times. Each retest depletes the resting orders defending the zone. The fourth touch usually breaks. Skip — or trade the break instead.
The cumulative delta just flipped regime. Bias change is fresh, old setups are invalidated, new setups have not formed. Wait at least one full session before re-engaging.
Major macro is within 15 minutes. CPI, FOMC, NFP — flow becomes distorted by event positioning. Profile signals are unreliable through the event. Step away.
Liquidity is thin. Sunday morning UTC, post-close Friday. Few buckets, easy to manipulate. Signal quality drops sharply.
Common mistakes
Reading CVD Profile like Volume Profile. If you are only looking at which bar is longest and ignoring the sign, you are throwing away the entire reason to use this indicator. Always read the delta share at the cluster before deciding it is resistance or support.
Entering on touch without flow confirmation. A zone is a region of interest, not an entry. The 5m flow at the moment of retest tells you whether the setup is live or whether you are catching a knife.
Ignoring session delta and the cumulative. Single-session profile shape gives you about half the picture. The other half — direction of overall flow, divergences, regime — lives in the multi-session view. Always check both before sizing up.
Single-anchor decisions. A 1h zone is not a 1d zone. Trading a 3-day swing off a 1h cluster is mismatched. Match the anchor to the holding period.
Overtrading signals. Profile gives you many signals per day. Most are weak. Trade the high-conviction confluences. Set a hard cap (e.g. three trades per session) and stop when you hit it.
Adjusting stops mid-trade because "the profile updated". The decision was made on the closed prior session. New profile data is for the next trade, not the current one. Move stops only on price-action milestones (target hit, structure break).
A simple pre-trade checklist
Run through these before every entry. If any answer is no, pass on the trade.
- Is the session you are using closed?
- Is the cluster you are trading either strongly buy-dominated or strongly sell-dominated (not absorption)?
- Is the cumulative delta on the larger anchor confirming — or, for reversals, clearly diverging?
- Has the zone been tested fewer than 3 times?
- Does the smaller anchor confirm the larger anchor's bias?
- Did the 5m flow at the entry confirm the setup direction?
- Is risk-to-reward at least 2:1 after fees?
- Is position size within your per-trade risk limit?
- No macro event in the next 15 minutes?
All yes — execute.
Where to go from here
CVD Profile is one of three order-flow lenses that work better together than apart. Once you have the profile read down, layer in the other two:
- Trading Chart with Depth Heatmap — Complete Guide — the resting-liquidity view. CVD Profile tells you who was in control at each price; the depth heatmap tells you who is currently defending each price.
- How to Read an Orderbook Heatmap for Trading — the five patterns (resting walls, spoofing, iceberg refresh, vacuums, stacked accumulation) that confirm or invalidate every CVD setup in this article.
- What Is a Footprint Chart? The Complete Guide — intrabar signed flow. Use it for the 5m "flow confirmation" filter at the entry trigger of every setup above.
- CVD indicator reference — settings, futures-vs-spot mode, divergence rules, and how to wire CVD into alerts on the mrD chart terminal.
When you are ready to test it live, open the chart terminal and toggle CVD Profile from the indicator panel. Setups become easier to see once the third lens is on.
Bottom line
CVD Profile does not predict the future. It tells you who is in control at each price right now. That information is the difference between trading at a support that holds and trading at a support that breaks — between catching the reversal and being caught in the distribution.
Combined with strict risk management, the right timeframe match, and the patience to skip mediocre setups, it is one of the cleanest edges available to a flow-aware trader. Without those three, no indicator will save you.
Trade fewer setups. Trade the high-conviction ones. Read the signed flow, not just the volume.
This article is education, not financial advice. Trading involves risk; never risk capital you cannot afford to lose.