CVD — Cumulative Volume Delta
Running sum of buy-aggressor volume minus sell-aggressor volume. Tracks net order-flow direction, with built-in CVD-vs-price divergence detection and an optional Futures-vs-Spot read.
CVD (Cumulative Volume Delta) is the running sum of buyVol − sellVol per bar — where buyVol is taker-buy volume and sellVol is taker-sell volume. It tells you who is paying — buyers lifting the offer or sellers hitting the bid — independently of the price action. When price keeps making highs but CVD stalls, aggressors are absorbing; when price holds a low and CVD turns up, sellers are exhausted. CVD paints in its own sub-pane below the chart, with a per-bar delta histogram, the cumulative curve itself, and optional CVD-vs-price divergence lines.
Settings reference
The dialog has two tabs — Inputs for what gets drawn, Style for how the divergence lines look.
| Section | Setting | Default | Notes |
|---|---|---|---|
| Inputs · CVD | Source | Futures | Which feed CVD reads — Futures, Spot, or Both (side-by-side futures + spot, with extra signals). |
| CVD style | Candles | How the cumulative curve is drawn — Line, Candles (per-bar OHLC of the cumulative), or Bars (centered tick-style bars from the zero line). | |
| Show delta bars | On | Per-bar buyVol − sellVol histogram at the bottom of the pane. In Both mode it paints side-by-side futures (left) and spot (right) bars on a shared Y-scale. | |
| Show divergence | On | CVD-vs-price divergence lines on the CVD pane and dashed marks on the main chart. | |
| Style · DIV | Bull | bull green | Solid line — regular bullish divergence (reversal up). |
| Bear | bear red | Solid line — regular bearish divergence (reversal down). | |
| H.Bull | dashed blue | Hidden bullish — uptrend continuation. | |
| H.Bear | dashed orange | Hidden bearish — downtrend continuation. |
The cumulative sum runs across the loaded history and is rebased to zero at the leftmost visible bar so the curve always starts on the zero line — pan or zoom and the rebase follows the new visible window. The pane's Y-axis auto-fits the visible range.
Reading the pane
What you see in the CVD sub-pane, top to bottom:
- Header legend —
CVDname, anF/Scolour key in Both mode, and the current cumulative value at the rightmost bar (or under the crosshair when you hover). In Both mode aΔvalue also shows futures-minus-spot at the same reference bar — positive teal means futures are leading, negative amber means spot is leading. - Zero line — dashed horizontal reference. The curve always starts here on the leftmost visible bar.
- Cumulative curve — line, candles or bars depending on the style setting. Coloured green when ticking up, red when ticking down.
- Per-bar delta histogram at the bottom — independent of the cumulative line. Green bars = net buying that bar, red bars = net selling. In Both mode the futures bar sits left, the spot bar sits right, both on the same Y-scale so heights are directly comparable.
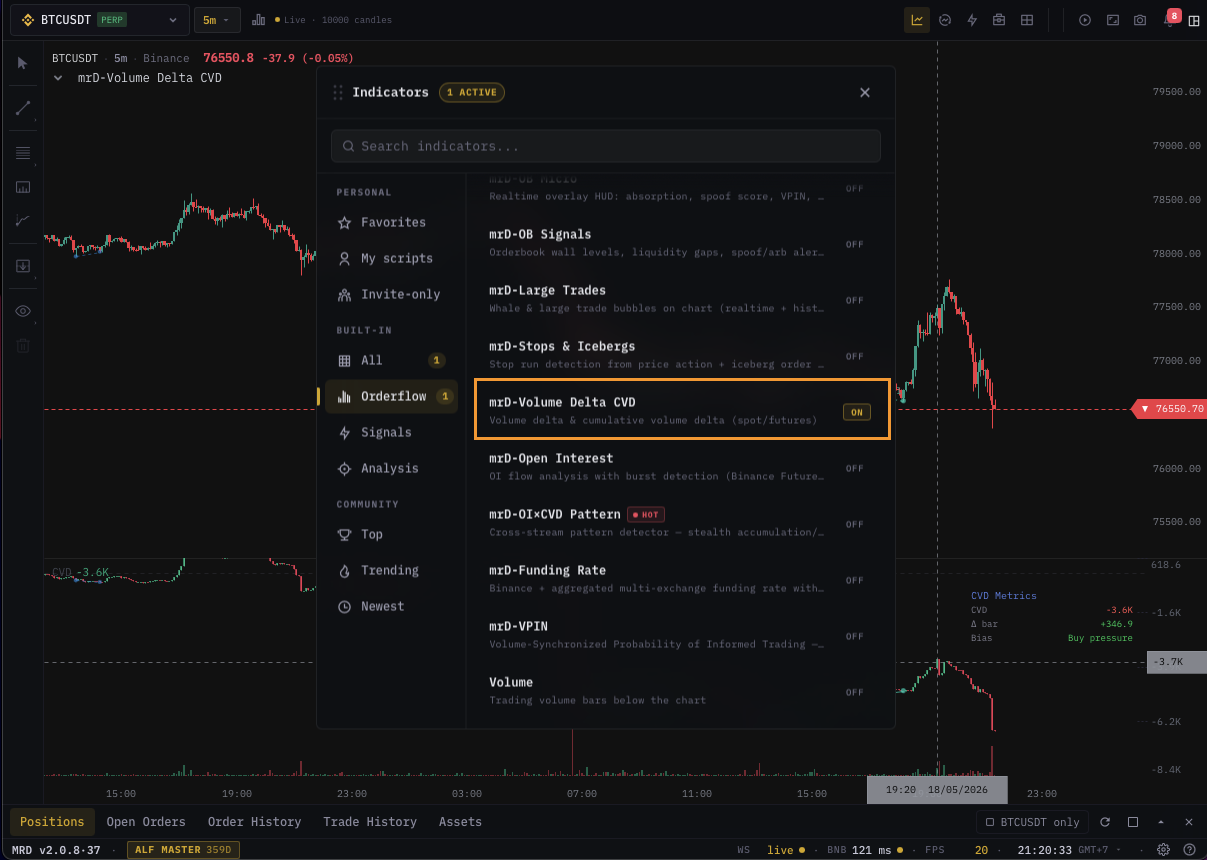
- Hover panel (top-right) —
CVD Metricstable with the rebased CVD,Δ bar(this bar's delta),Bias(Buy / Sell / Flat). In Both mode it also showsCVD Spot,Δ spot, andΔ F−S.
CVD-vs-price divergence
When Show divergence is on, the indicator scans price swing pivots against the CVD curve and draws four divergence types — solid lines for regular (reversal) divergences, dashed lines for hidden (continuation) divergences.
| Type | Price | CVD | Read |
|---|---|---|---|
| Regular Bullish | Lower low | Higher low | Reversal up — sellers running out of fuel |
| Regular Bearish | Higher high | Lower high | Reversal down — buyers exhausted |
| Hidden Bullish | Higher low | Lower low | Uptrend continuation |
| Hidden Bearish | Lower high | Higher high | Downtrend continuation |
Each divergence is anchored at two pivots — small circles mark the endpoints, a label (Bull / Bear) prints over the midpoint on the main chart. A "clean line" check filters out patterns where an intermediate CVD value breaks the trend between the two pivots, so the lines you see have actually held throughout the gap.
Futures vs Spot — the Both mode
Switching Source to Both paints two cumulative curves on the same pane — futures in blue, spot in violet — and adds signal markers that fire when their delta flows disagree or align. The markers use 2-letter codes you'll see drawn at each trigger:
| Code | Meaning | Trading read |
|---|---|---|
SB / SS | Strong Buy / Strong Sell | Both feeds aligned and strong — high-conviction move |
FB / FS | Futures-Lead Buy / Sell | Leveraged flow is driving; spot is quiet — fragile, prone to fakeout |
SA / SD | Spot Accumulation / Distribution | Organic real-money flow; futures lagging |
DB / dB | Diverge Bull / Bear | Feeds disagree — possible reversal or trap |
Both mode is the cleanest way to separate leveraged squeeze moves (futures-only flow) from real accumulation (spot-led flow). It only works when you have an obvious spot pair for the symbol — futures-only assets show the single-source curve.
How to read it
- Trending market — CVD rises with price (long bias confirmed) or falls with price (short bias confirmed). Skip the divergence read when both move together.
- Bullish divergence — price makes a lower low, CVD makes a higher low. Sellers are running out of fuel; pair with a price-action trigger before entering.
- Bearish divergence — price makes a higher high, CVD makes a lower high. Buyers are exhausted.
- Absorption — price stalls at a level while CVD keeps climbing (or falling). One side is absorbing the other; expect a breakout in the absorbing side's direction.
- Bars style — useful on dense / sub-minute charts where the candle bodies of the OHLC style get noisy. The thin tick-style bars from the zero line stay readable when the pane is compressed.
Common pitfalls
- Reading divergence in a sideways market — CVD ticks back and forth with no signal in chop. Wait for a clean trend before trusting divergence.
- Confusing the rebase for a reset — the curve always starts at zero on the leftmost visible bar so you can compare relative moves across the visible window. The underlying cumulative isn't actually reset on a schedule; pan back to see the prior history rebased to its own start.
- Trusting an
FB/FSsignal as a long-term direction call — futures-lead moves are typically squeezes. Treat them as fragile and watch for a reversal once spot fails to follow. - Using CVD alone for entries — CVD is a confirmation tool. Pair with a price-action trigger (S/R bounce, candle pattern, indicator signal).
What's next
- CVD Profile — same delta read but plotted by price level instead of time.
- Volume — magnitude without direction.
- Large Trades — the per-trade view of what makes up the CVD aggregate.
- OI / CVD Pattern — pairs CVD with open-interest to classify squeeze vs absorption regimes.