DOM Ladder
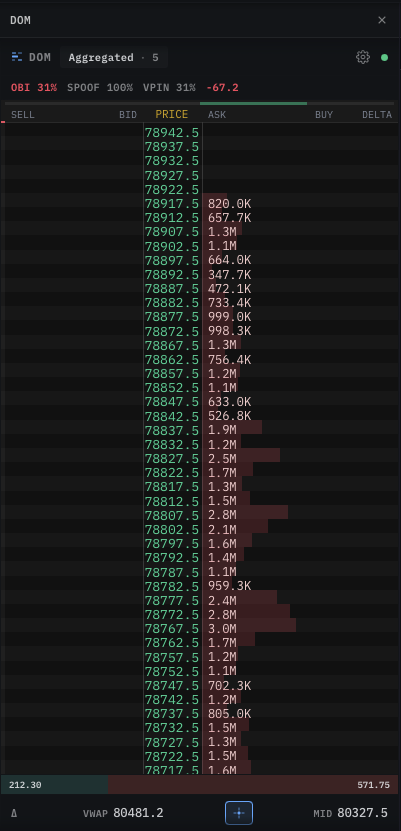
Standalone DOM (Depth-Of-Market) price ladder — a vertical bid/ask ladder rendered into its own canvas, separate from the main chart. Real-time depth + aggressive trades + DOM-volume accumulator + walls.
The DOM Ladder is a standalone module with its own engine, its own canvas, and its own data feed. It is not the depth heatmap that lives behind the candles on the main chart (that's Orderbook Heatmap) — this is the vertical, per-tick price ladder familiar from professional desktop tools, designed to sit beside the chart and show real-time book + trade activity at each price level.
Use cases:
- A right-hand panel in a chart workstation (chart on the left, DOM on the right).
- A standalone trading widget on a tablet or mobile screen.
- An order-entry surface where the user clicks a price row to place a limit.
If you need order-flow signals (OBI, spoofing detection, absorption, flow, walls) painted on the same ladder, or a multi-exchange depth-profile view with horizontal liquidity bars per price level, use the heavier Orderbook · Depth Profile module instead.
Install & import
import { createDomLadderBridge } from '@mrd/chart-engine'
The package ships every engine — the chart, the DOM ladder, the orderbook panel, the tick stream — under one import. You only pay for the engines you instantiate; tree-shaking strips the rest in production builds.
Attach to a canvas
The DOM ladder needs its own <canvas> — never share with the main chart.
<div class="dom-wrap" style="width: 280px; height: 600px;">
  <canvas ref="domCanvas" style="width: 100%; height: 100%;"></canvas>
</div>
Sizing rule. The canvas itself relies on width: 100%; height: 100%. The parent (.dom-wrap) is what defines the actual pixel size. Give the parent an explicit width and height (px, vh, flex layout — anything that resolves to non-zero). A zero-height parent is the #1 cause of "the ladder mounted but doesn't render".
Mount
const dom = await createDomLadderBridge(canvas, {
  symbol: 'BTCUSDT',
  tickSize: 0.5,
  pricePrecision: 2,
  visibleRows: 40,
  theme: 'dark',
})

dom.start()
createDomLadderBridge(canvas, options) resolves to a DOM instance — the object exposing every method below.
Options
| Option | Type | Default | Description |
|---|---|---|---|
symbol | string | — | Optional label used by the header / hover. |
tickSize | number | 1 | Price increment between rows (e.g. 0.5 for BTCUSDT). |
pricePrecision | number | 2 | Decimals shown on price column. |
visibleRows | number | 40 | Number of price rows rendered. 40 is the sweet spot; 30-60 covers most use cases. |
theme | 'dark' | 'light' | 'dark' | Initial theme. |
textScale | number | 1.0 | Global font-size multiplier (0.7-1.5). Bump for tablet displays. |
fillIntensity | number | — | 0..1 scale on bid / ask / delta fill alphas. |
qtyDisplayUsd | boolean | false | If true, the depth / aggregate / delta numerals show in quote-notional (qty × price) instead of base-coin qty. |
Push data
Two streams feed the ladder. Both are independent — you can run the ladder with just pushBook, just appendTrade, or both.
dom.pushBook(bids, asks, midPrice)
Full snapshot of the orderbook at one instant. Call on every depth update from your data source — typically 5-10 Hz.
| Argument | Shape | Description |
|---|---|---|
bids | Float64Array or Array<[price, qty]> | Bid levels. Flat path (typed array [p0, q0, p1, q1, …]) is faster. |
asks | Float64Array or Array<[price, qty]> | Ask levels. Same shape options. |
midPrice | number | Current mid (average of best bid + best ask). Drives ladder centering. |
// Object path (convenient, allocs once per call)
ws.on('depth', (d) => {
  dom.pushBook(d.bids, d.asks, d.mid)
})

// Flat path (faster — pre-allocate and reuse the buffer)
const bidBuf = new Float64Array(40 * 2)
const askBuf = new Float64Array(40 * 2)
ws.on('depth', (d) => {
  for (let i = 0; i < d.bids.length; i++) {
    bidBuf[i * 2]     = d.bids[i][0]   // price
    bidBuf[i * 2 + 1] = d.bids[i][1]   // qty
  }
  // ... same for asks
  dom.pushBook(bidBuf, askBuf, d.mid)
})
The engine replaces the previous snapshot — there is no incremental delta path. If your exchange feed is delta-style, accumulate into a local book in JS, then push the resulting snapshot.
dom.appendTrade(price, qty, isBuy, ts)
A single aggressive trade. Lights up the row briefly (a "fill flash") and feeds the optional DOM-volume accumulator.
| Argument | Type | Description |
|---|---|---|
price | number | Trade price. |
qty | number | Trade size in base units (or quote notional, depending on qtyDisplayUsd). |
isBuy | boolean | true if the taker bought (hit the ask). |
ts | number | Unix milliseconds. Optional; defaults to Date.now(). |
ws.on('trade', (t) => {
  dom.appendTrade(t.price, t.qty, !t.isBuyerMaker, t.ts)
})
Aggressor convention. Most exchange websockets ship
isBuyerMaker: bool. If the buyer was the maker (resting bid), the aggressor was a seller — soisBuy = !isBuyerMaker. Verify once against a known trade on your exchange, then forget about it.
dom.pushDomVol(buckets) / dom.clearDomVol()
Optional DOM-volume accumulator: a per-price total of buy vs sell aggressive flow over a recent window. Renders inline on the ladder alongside the resting depth.
dom.clearDomVol()  // reset on new bar
dom.pushDomVol([
  { p: 67450.2, b: 1.55, s: 0.05 },  // {price, buyVol, sellVol}
  { p: 67450.0, b: 0.80, s: 2.10 },
  // ...
])
The bucket keys are short (p, b, s) for hot-loop bandwidth; full names (price, buy, sell) are accepted as aliases.
dom.setWalls(bidWallPrices, askWallPrices)
Highlight specific price rows as walls (large resting orders that need to be cleared). Detection happens in your data layer — the engine renders the prices you tag.
dom.setWalls(
  [67400, 67380],  // bid walls
  [67600, 67700],  // ask walls
)
Display controls
Every setter is no-op-safe — calling them before the first pushBook is fine.
| Method | Effect |
|---|---|
dom.setTickSize(t) | Change row spacing live (e.g. switching between BTC and SOL pairs). |
dom.setPricePrecision(d) | Decimals on the price column. |
dom.setVisibleRows(n) | Resize the ladder up or down — engine re-centers automatically. |
dom.setTextScale(scale) | Global font multiplier (0.7-1.5). |
dom.setFillIntensity(v) | Scale on bid / ask / delta fill alphas (0-1). |
dom.setQtyDisplayUsd(enabled) | Toggle quote-notional display (qty × price) vs base qty. |
dom.setTheme('dark' | 'light') | Theme switch — repaints on next frame. |
dom.centerOnMid() | Snap the ladder so mid is at the vertical center. |
Hover
canvas.addEventListener('pointermove', () => {
  const price = dom.getMomentum?.()  // current centered price, useful for debug overlays
  // ... your own hover-row read logic if needed
})
The ladder paints its own row-highlight on hover; you typically don't need to subscribe to anything. If you need to read the hovered row programmatically (e.g. to populate an order ticket), expose it via your own pointer-event handler reading from the canvas's bounding rect — the engine renders the highlight, your component handles the click.
Lifecycle
const dom = await createDomLadderBridge(canvas, options)

dom.start()    // begin render loop
dom.resize()   // call when the parent's CSS size changes (ResizeObserver, ideal)
dom.stop()     // pause render loop (data still ingested)
dom.destroy()  // permanent — frees listeners + internal buffers
A canvas owned by createDomLadderBridge cannot be reused for another engine. To swap symbol, call setSymbol + setTickSize on the same instance and keep the canvas — don't re-mount.
Common pitfalls
Ladder mounts but doesn't render.
The parent of the canvas has zero height. Check its computed CSS — give the wrapping <div> an explicit pixel / vh / flex-driven height.
Rows are blurry on Retina / 4K.
The engine measures the device pixel ratio at mount. If you mount the canvas while it's still display: none, the DPR read returns the wrong value. Mount visible, OR call dom.resize() after the canvas becomes visible.
The ladder lags behind the data feed.
Most likely cause: you are calling pushBook on every single websocket message including the delta updates between full snapshots. Snapshot 5-10 Hz is plenty — coalesce on your side if the feed is faster than the engine can paint.
appendTrade flashes the wrong side.
Inverted isBuyerMaker convention. Most exchanges ship is_buyer_maker = true when the buyer is the resting maker (so the aggressor is a seller). Pass isBuy = !isBuyerMaker. Verify once against one known trade — then it's set forever.
Numbers look "too big" or "too small".
You're mixing base-quantity and quote-notional. Pick one — set qtyDisplayUsd: true at mount if your data source emits notional, leave it false if it emits coins. Mixing them across pushBook and appendTrade produces an inconsistent ladder.
Memory grows on long sessions. The internal book buffer is fixed-size — old snapshots are dropped automatically. Memory growth almost always lives in your own snapshot-history array or your websocket-listener fan-out. Take a heap snapshot; the engine module's allocation should plateau within a minute of mount.
pushDomVol data resets every render.
You forgot to clearDomVol() when the bar rolled. Accumulated rows from the previous bar bleed into the new one. Call clearDomVol() once at bar boundary, then push the new bucket list.
Next
- Orderbook · Depth Profile — single-venue order-flow view with signal overlays, OR multi-exchange depth profile with horizontal liquidity bars + labeled walls — same engine, two modes.
- Tick Stream — trade tape with VWAP, large-trade markers, and a micro book heatmap.
- Orderbook Heatmap (Depth) — the depth-as-color-matrix view embedded in the main chart.