Chart Terminal — Overview
Anatomy of the mrD-Indicators chart terminal. Top toolbar, left drawing toolbar, indicator panel, chart canvas, side panel, bottom panel, status bar, and floating trade controls — what each surface does and how they share state.
The chart terminal at /trading/chart-terminal is the everyday workspace for everyone who uses the platform — analysts, signal followers, manual traders, and bot operators. Every other surface on the app (scanners, signal hubs, autotrade, alerts) eventually points back into this page so you can see the chart that produced the signal, the level that triggered the alert, or the candle that fired the entry. This overview walks the anatomy of one pane so the rest of the Chart Terminal docs can drill into individual controls without re-explaining where they live.
Who the terminal is for
| Audience | What they spend most of their time on |
|---|---|
| Price-action traders | Drawing tools, chart types, replay mode, indicator overlays. |
| Signal followers | Bottom-panel signal tab, indicator alerts, position lines synced from signal hubs. |
| Discretionary intraday | Symbol search, multi-pane layouts, quick-trade bar, footprint / heatmap overlays. |
| Bot operators | Autotrade dialog opened from the chart, position lines for active bots, status-bar P&L. |
| Researchers | Side-panel orderbook / depth profile / whales, multi-exchange comparison, replay. |
You do not have to enable a "mode" — the same workspace serves all of them and remembers your per-account layout between sessions.
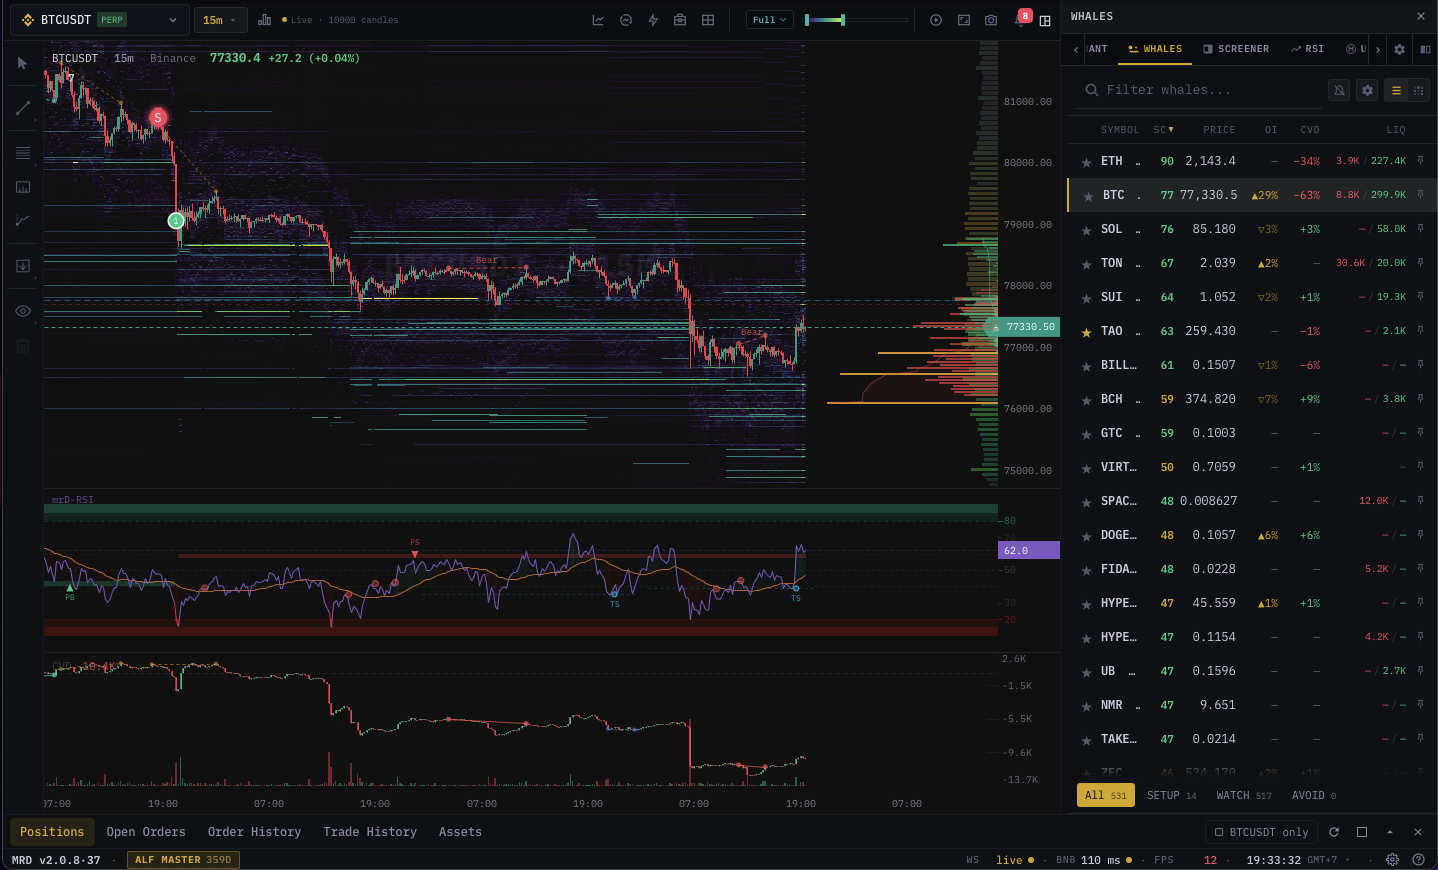
Anatomy of one pane
Open the terminal and you see a single pane by default. Each pane is a fully independent chart engine: its own symbol, timeframe, indicator stack, drawings, side-panel state, and connection. You can split the workspace into up to six panes (see Layouts) and every pane below behaves the same way.
Top toolbar
The bar across the top of the chart hosts the controls you change most often.

- Symbol picker with multi-tab favorites — see Symbol search & watchlist.
- Timeframe menu with crypto, FX, and custom presets — see Timeframes.
- Chart type selector — Candlestick plus three Footprint modes (Bid×Ask, Delta, Volume), and the separate Tick · Heatmap mode. See Chart types.
- Heatmap visibility slider — toggles the depth-of-book heatmap painted behind the candles, with a sensitivity slider.
- Indicators button — opens the indicator catalog.
- Replay button — drops the chart into bar replay; see Replay mode.
- Layout button — picks from 15 multi-pane grid templates.
- Settings cog — opens the Chart Settings dialog.
- Theme toggle (dark / light).
Left toolbar — drawing tools
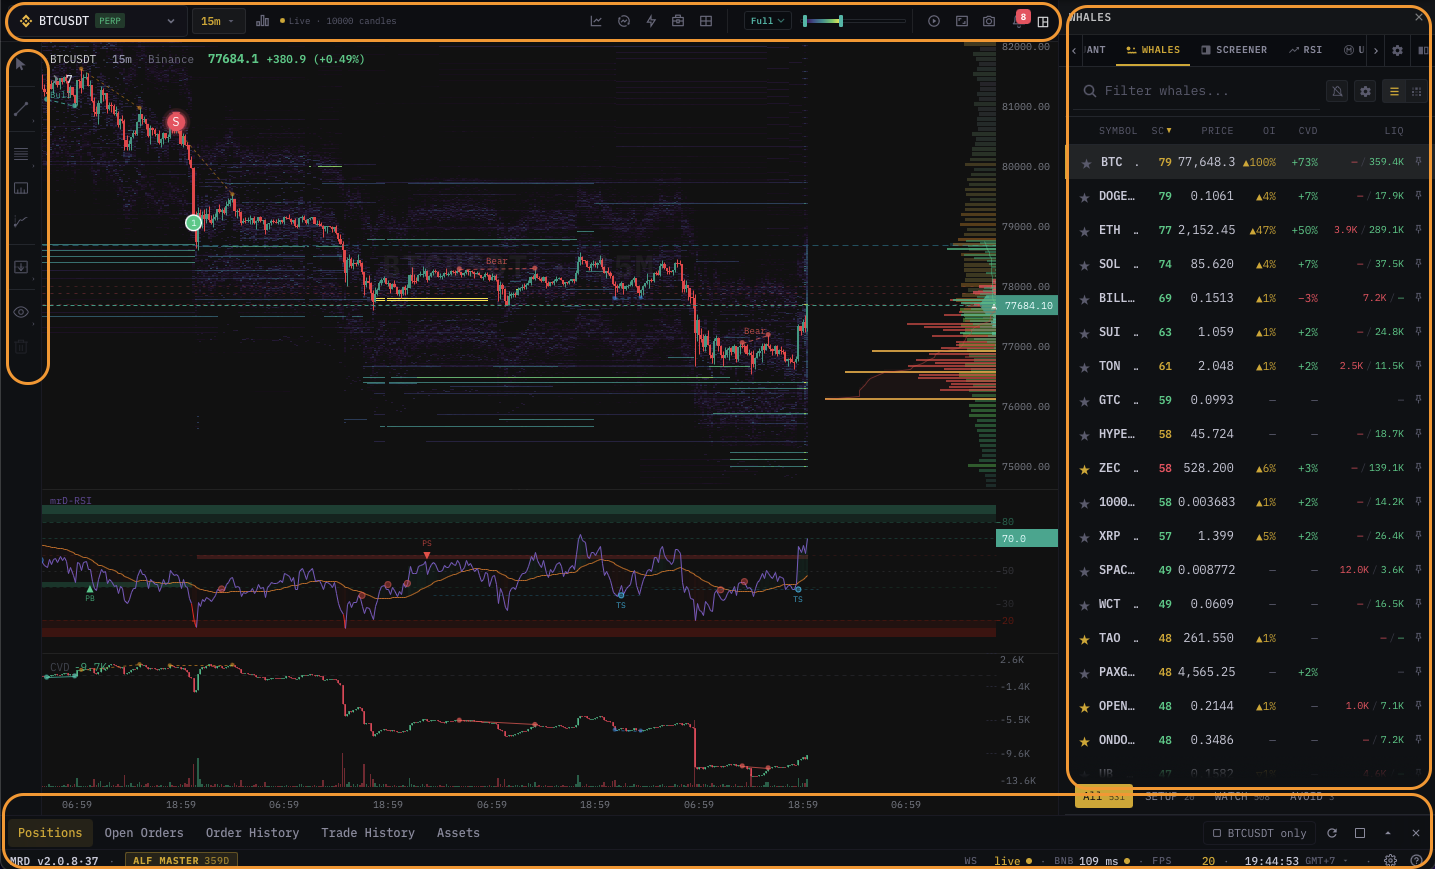
Vertical strip down the left side. Trendlines, horizontals, fibs, parallel channels, arrows, text, brushes, measure, and a clear-all action. See Drawing tools for the full set, edit popup, and persistence rules.
Indicator panel
Strip above the chart canvas. Lists every enabled indicator with a one-line summary, a focus toggle (hide the rest), and a gear icon that opens per-indicator settings. The full catalog opens from the toolbar; the strip itself manages what is already on the chart. See Indicator panel basics for the catalog entry flow and per-pane vs. global behaviour.
Chart canvas
Where the data is rendered:
- Candles (or your chosen chart type).
- Depth heatmap behind the candles (toggleable).
- Footprint cells inline on the candle (toggleable).
- Indicator overlays — EMA, VWAP, VRVP, CVD profile, large trades, liquidations, etc.
- Drawings — your trendlines and markers.
- Live overlays — position lines, working-order lines, take-profit / stop-loss bands, AI marks, replay scrubber.
Side panel (right)
Tabbed panel docked on the right. Default tabs: Orderbook, Walls, Depth Profile, Multi-exchange Depth, Whales, Live Signals, Bot status. Tabs are independent per pane — you can pin a different tab in each pane of a multi-pane layout. Drag the divider to resize.
Bottom panel
Tabbed panel docked at the bottom. Open Positions, Working Orders, Conditional Orders, Trade History, Indicator Alerts, Screener Alerts, Account telemetry, and (for bot users) Bot Activity. The same panel surfaces across all panes — only one bottom panel per page, shared.
Floating trade controls
- Floating trade bar — minimal BUY / SELL pair docked over the chart for one-click entries; full setup in Quick trade.
- Quick trade dialog — full order form with size, leverage, TP, SL, conditional triggers, and bot-mode switch.
- Position lines — live entry, TP, SL, and average lines painted on the chart for any open position.
Status bar
Strip at the very bottom. Shows connection status, last tick timestamp, account balance and unrealized P&L, current exchange, and the master sound / mute toggle. Per-pane crosshair price + percent change appears at the top right of each pane when you hover.
How panes share state
Splitting the workspace into multiple panes does not give you independent accounts. The same exchange connection, account balance, open positions, working orders, indicator alerts, and signal subscriptions are shared across every pane. What is independent per pane:
- Symbol
- Timeframe
- Chart type
- Indicator stack (each pane can run its own indicators)
- Drawings
- Side-panel tab choice and side-panel data
- Chart-specific settings (e.g. heatmap sensitivity, candle colors)
Anything money-related is global. That keeps the BUY button safe — if you have three BTC panes open and click BUY in any of them, you place one order against your one account.
Persistence
Layout, panes, symbols, timeframes, indicator state, drawings, theme, and side-panel choices are saved to your account every time you make a change (look for the small "saved" tick on the layout button). The next time you log in, your terminal opens exactly how you left it — on any device.
If you want a fresh start, the layout panel has a Reset workspace action that returns to the default single-pane BTCUSDT / 1H view without touching your saved indicator presets or alerts.
Mobile
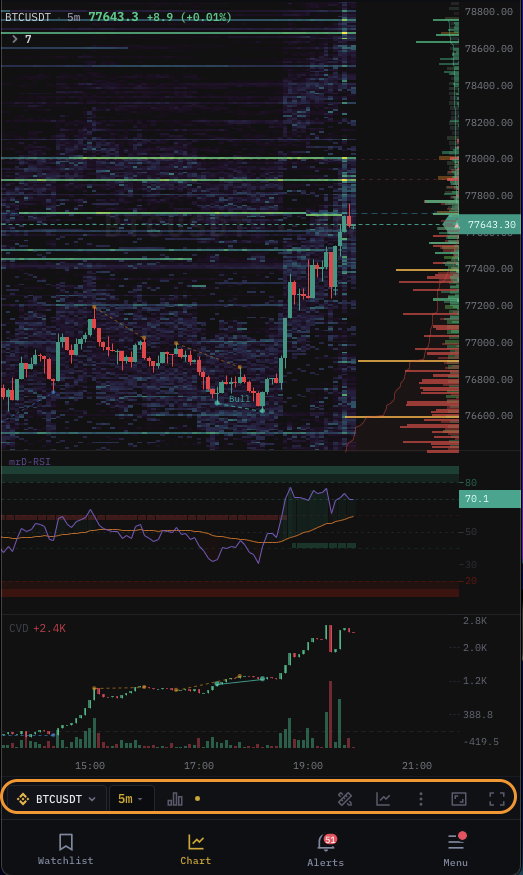
The mobile build is a parallel layout — the same data, same indicators, same orderbook, same trade controls — laid out for one thumb. The toolbar collapses into a "More" menu, the side panel becomes a swipe-from-right drawer, and the bottom panel becomes a swipe-from-bottom sheet. Multi-pane layouts are desktop-only; mobile is fixed at one pane. Full mobile coverage in Mobile experience.
What's next
The rest of the Chart Terminal documentation drills into one surface at a time:
- Layouts — splitting into multiple panes.
- Symbol search & watchlist — finding pairs, organizing favorites.
- Timeframes — crypto and FX TFs, custom presets.
- Chart types — Candlestick, the three Footprint modes, and Tick · Heatmap.
- Drawing tools — left toolbar, edit popup.
- Indicator panel basics — catalog, enable, focus, settings.
- Quick trade & floating bar — placing orders without leaving the chart.
- Replay mode — backtesting feel, scrub through history.
- Status bar & tooltips — what the strip at the bottom tells you, hover overlays.
- Settings dialog & themes — chart settings, theme toggle, persistence.
- Mobile experience — touch controls, drawers, mobile-only behaviour.
- Widgets — the widget picker and the 12 dockable widgets (Order Book, DOM, Whales, Screeners, Trade, Positions, Liquidations, Custom Scripts).
For panels beyond the basics — the deep tabs inside the side panel and bottom panel — see the Side Panel + Bottom Panel category.