Drawing tools
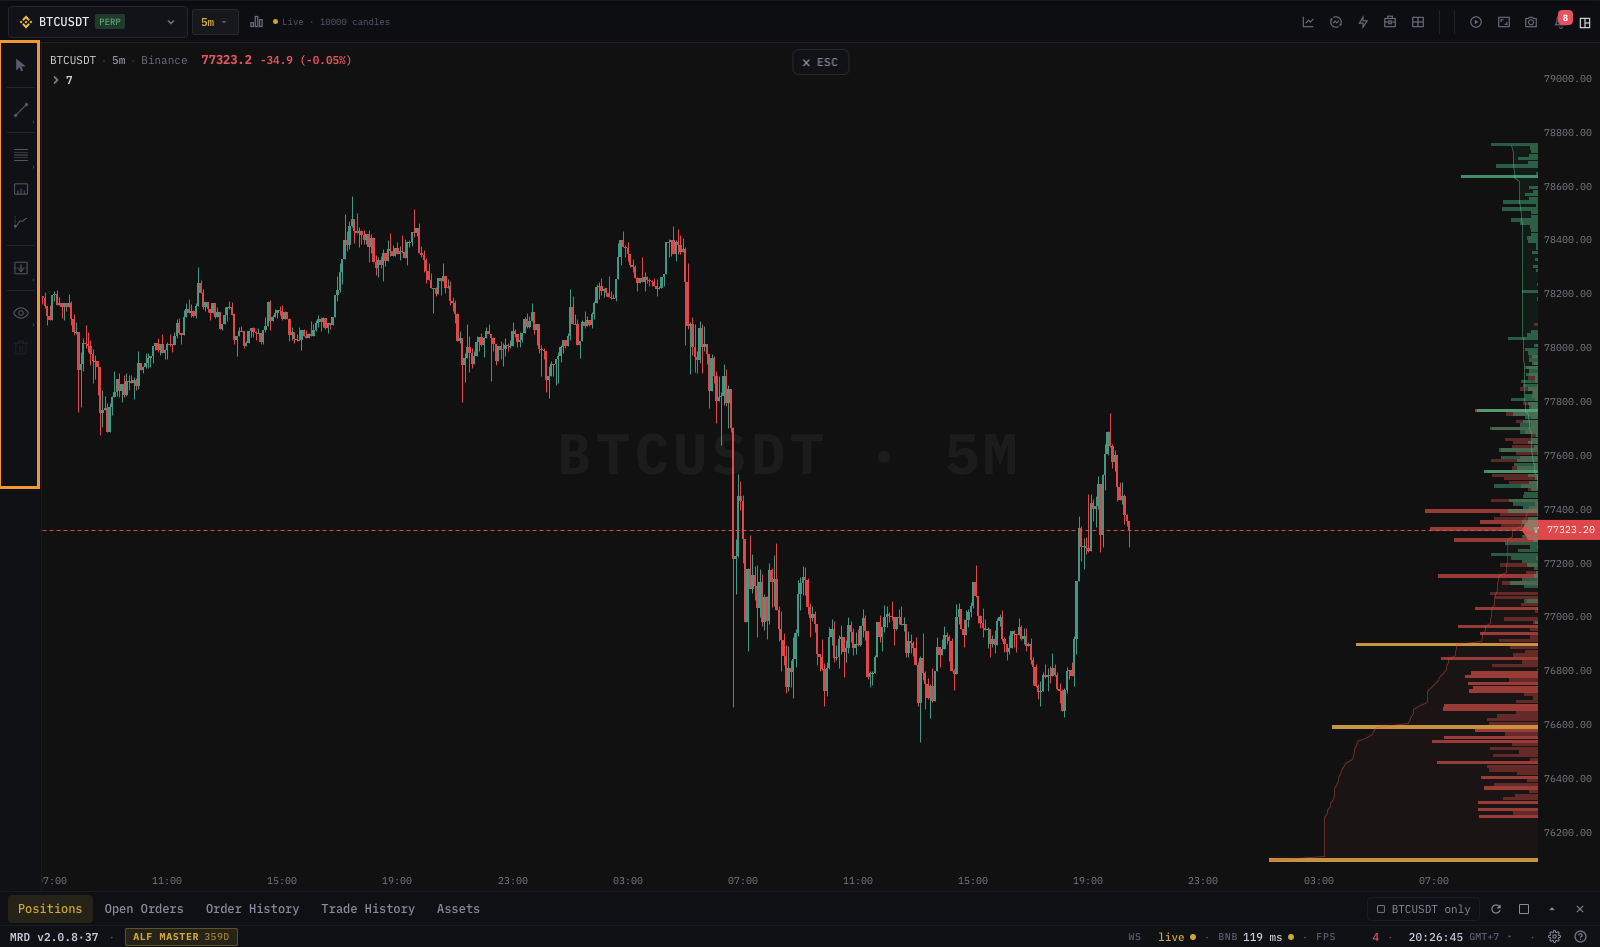
The left-side drawing toolbar — trendlines, horizontals, fibs, channels, arrows, brushes, measure, text. Edit popup, snap behaviour, persistence, and clearing.
The left toolbar holds every drawing tool — trendlines, horizontals, parallel channels, Fibonacci levels, arrows, text, brushes, and the measure tool. Drawings are per-pane, persist across sessions, and can be edited from a floating popup that appears when you click a finished drawing. This page covers the full tool set, the edit popup, snap behaviour, and clearing.
Opening the toolbar
The toolbar is docked on the left edge of each pane and is always visible on desktop. On mobile it collapses into the Draw entry inside the More menu — see Mobile experience.
Each icon represents one tool. Click an icon to arm it (it stays armed until you finish a drawing or press Esc).
The tool set
| Tool | What it draws | Common use |
|---|---|---|
| Cursor | Default — selects drawings on click. | Editing existing drawings. |
| Trendline | Two-point line between two clicks. | Trend channels, swing connections. |
| Horizontal line | Single click → infinite horizontal. | S/R levels, key prices. |
| Vertical line | Single click → infinite vertical. | Event markers (news, session opens). |
| Ray | Two clicks → directed ray to infinity. | One-sided trendlines. |
| Parallel channel | Two clicks for the base, drag for the parallel offset. | Trend channels, regression. |
| Fibonacci retracement | Two clicks → 0% / 23.6% / 38.2% / 50% / 61.8% / 78.6% / 100% bands. | Pullback targets. |
| Fibonacci extension | Three clicks (A-B-C). | Wave extensions. |
| Fibonacci timezone | Two clicks (time start, time scale). | Time-based projections. |
| Pitchfork | Three clicks. | Andrews' pitchfork. |
| Long position | Two clicks (entry, target) → entry/TP/SL strip with R-R. | Trade planning. |
| Short position | Two clicks (entry, target) → entry/TP/SL strip with R-R. | Trade planning. |
| Arrow | Two clicks → straight arrow. | Annotations. |
| Text | Single click → text input. | Notes on the chart. |
| Brush | Hold and drag → freehand stroke. | Quick sketches. |
| Measure | Two clicks → returns time, price delta, %, bars between. | Range / move analysis. |
| Clear all | Removes every drawing on the current pane. | Workspace reset. |
The exact order and grouping in the toolbar may shift as we add tools, but the catalogue above is the canonical set.
Drawing flow
- Click a tool's icon — the cursor turns into a crosshair.
- Click on the chart for the first anchor point.
- (For two-point tools) move the cursor — a preview follows it. Click again to finish.
- (For multi-point tools like pitchfork and fib extension) keep clicking until all anchors are placed.
- The tool stays armed by default — click again to draw another of the same type, or press
Esc/ pick a different tool to disarm.
Snap behaviour
The crosshair snaps by default to:
- The candle wick high/low under the cursor.
- The candle open/close prices.
- Existing drawing endpoints (so you can stack levels accurately).
To disable snapping for a single click, hold Alt while clicking. To disable globally, toggle Snap to candles in Chart settings → Drawings.
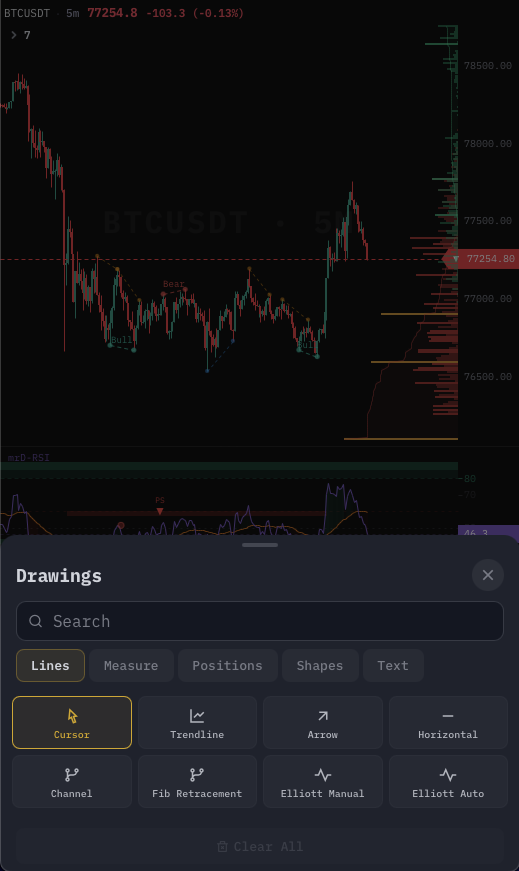
Edit popup
Click a finished drawing to select it. A floating edit popup appears next to the drawing with:
| Section | What it controls |
|---|---|
| Style | Line color, line width, line type (solid / dashed / dotted), fill color (for shapes / fibs / channels). |
| Anchors | Numeric edit for each anchor point's price + time. |
| Visibility | Show / hide across TFs (e.g. only show this drawing on 1H and above). |
| Lock | Prevent accidental drag or delete. |
| Alert | Arm a price alert that fires when price crosses this drawing — full setup in Trading alerts. |
| Delete | Remove the drawing. |
The popup is teleported to body so it can extend beyond the pane boundary. Click outside to dismiss.
Multi-select
Hold Shift and click multiple drawings to select them as a group. The edit popup then applies style changes to all selected drawings at once. Delete key removes the group.
Reordering drawings
Right-click any drawing → Bring to front / Send to back. Useful when overlapping fibs and channels obscure each other.
Per-TF visibility
By default a drawing is visible on every TF. To pin it to specific TFs, open the edit popup → Visibility and tick the TF list. Common patterns:
- Draw a 4H trend channel that only appears on 4H and above (don't clutter the 5M).
- Draw a 1m intraday level that only appears on 1m / 3m / 5m.
The TF filter applies per drawing — your 1D drawings won't disappear when you flip down to 5m unless you explicitly hide them.
Persistence
Drawings are saved per pane per symbol to your account. They sync across devices. Switching layouts preserves drawings:
- Switching to a multi-pane layout keeps each pane's drawings.
- Loading a per-chart preset replaces drawings on the active pane with the preset's drawings.
- Resetting the workspace does not delete drawings — it only resets layout and pane content. Drawings stay archived per symbol.
To delete every drawing on the active pane: click Clear all in the toolbar. A confirmation dialog opens before the wipe (no native browser confirm — full in-app dialog).
Drawing alerts
Arm a price alert directly from a drawing. With the drawing selected, open the edit popup → Alert → set:
- Trigger (cross above, cross below, touches).
- Sound on / off.
- Push / email / Telegram delivery.
- Notes.
The alert lives in your unified alerts inbox and survives deletion of the chart's pane — you can delete the drawing and the alert keeps firing until you cancel it explicitly.
Common questions
My drawings disappeared after I changed symbol. Drawings are per-symbol. Switching from BTCUSDT to ETHUSDT shows ETH's drawings, not BTC's. Switch back and BTC's drawings reappear.
I drew a trendline on 1m but it doesn't show on 1D. Open the edit popup → Visibility and tick 1D. Most likely the drawing was created with TF visibility scoped to 1m.
The crosshair snaps to a candle I don't want to snap to.
Hold Alt while placing the click to bypass snap for that anchor.
Brush strokes drop frames. Brush strokes are vector-rasterized on the GPU. On older machines a very long stroke can degrade frame-rate temporarily; finishing the stroke restores frame-rate.
Can I import drawings from TradingView? Not directly — there is no published TradingView drawing format. We are exploring a Pine Script-compatible import — track the roadmap.
Keyboard shortcuts
| Key | Action |
|---|---|
Esc | Disarm the current tool. |
Delete / Backspace | Remove the selected drawing(s). |
Ctrl + Z | Undo the last drawing action (limited to the last 50 actions). |
Ctrl + Shift + Z | Redo. |
Alt + click | Bypass snap for that anchor. |
Shift + click | Add a drawing to the current selection. |
What's next
- Quick trade & floating bar — convert a planned Long-position drawing into a live order.
- Trading alerts — arm alerts on drawings.
- Settings dialog & themes — snap toggles and default drawing colors.