Introduction
The mrD-Indicators suite of invite-only TradingView studies — Smart Ranges, Open Interest, mrD-Signals Premium, mrDAlgo, RSI Swing. What each study does, how access works, and how to enable them on your chart.
The TradingView indicator suite is for traders who already live inside TradingView and want our signal models layered onto their existing layouts, watchlists, and alerts. Each study is published as an invite-only Pine script. You link your TradingView username to your mrD-Indicators profile, accept the access invite, and the study appears in your TradingView "Indicators → Invite-only" list — same as any premium script you would buy from a published author.
The suite
Five production studies. They are designed to be used together as a workflow rather than independently — Smart Ranges marks the structural zones, Open Interest tells you when fresh money is committed to those zones, RSI Swing adds the momentum context, and the two signal models (mrD-Signals Premium and mrDAlgo) issue the higher-quality composite entries when the underlying conditions align.
Click any card to open the script on TradingView and request access.
What each study contributes
A short read on how each one fits into the workflow once it is on your chart.
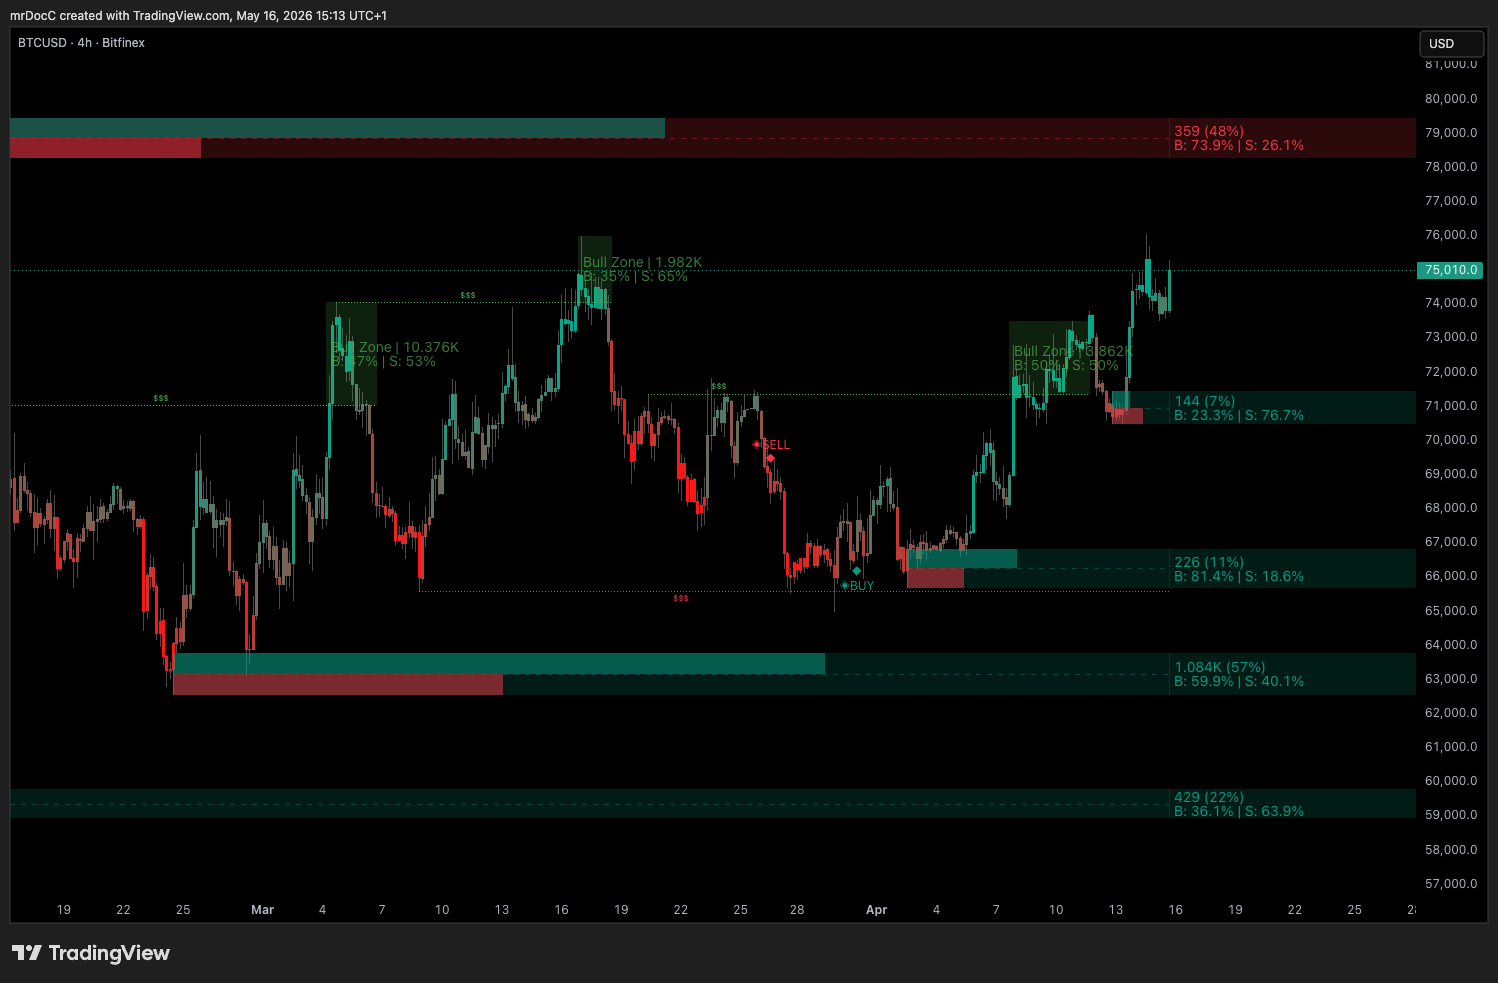
mrD-Smart Ranges — structure and entries
A range-detection engine focused on the moment a range breaks with intent versus the moment it fakes out. The study:
- Auto-classifies consolidations into order-block zones on the current timeframe and on a configurable higher timeframe.
- Highlights the highest-volume blocks in each timeframe so you can see where the heavy resting orders are sitting.
- Marks BUY / SELL signals when price retests one of those zones, with suggested entry, take-profit, and stop levels.
Use it as the structural map plus the entry trigger for setups that respect the higher-timeframe levels.
Full settings reference: mrD-Smart Ranges.
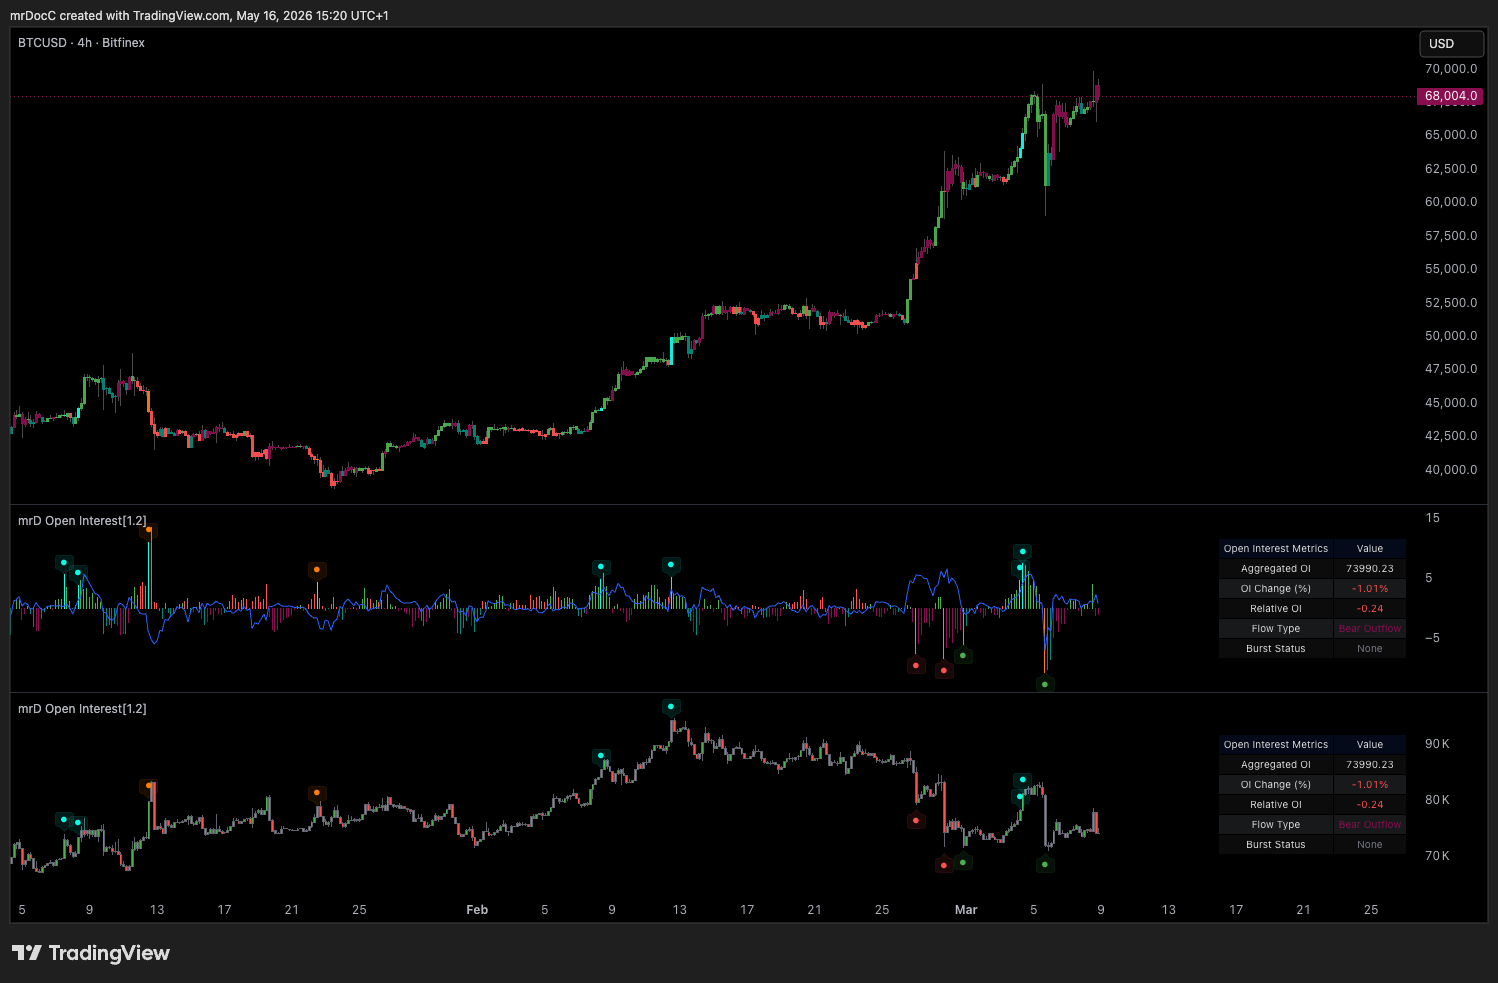
mrD Open Interest — committed money behind a move
Open Interest (OI) is the total number of open derivatives positions in a market. Rising OI alongside a price move means new money is committing to the direction; falling OI means existing positions are closing. The study:
- Aggregates OI across selectable exchanges (Binance, BitMEX, Kraken) and quote pairs (USDT, USD, BUSD) so you read total market commitment rather than a single venue's slice.
- Classifies every candle into one of four money-flow patterns — Buy Inflow (price up, OI up), Sell Inflow (price down, OI up), Buy Outflow (price down, OI down), Sell Outflow (price up, OI down).
- Flags bursts — abrupt OI changes that historically precede strong continuation or reversal — and surfaces an info table with aggregated OI, OI change %, relative OI and current flow type.
Use it as the conviction filter that tells you whether a price move is supported by fresh positioning or is just position-shuffling.
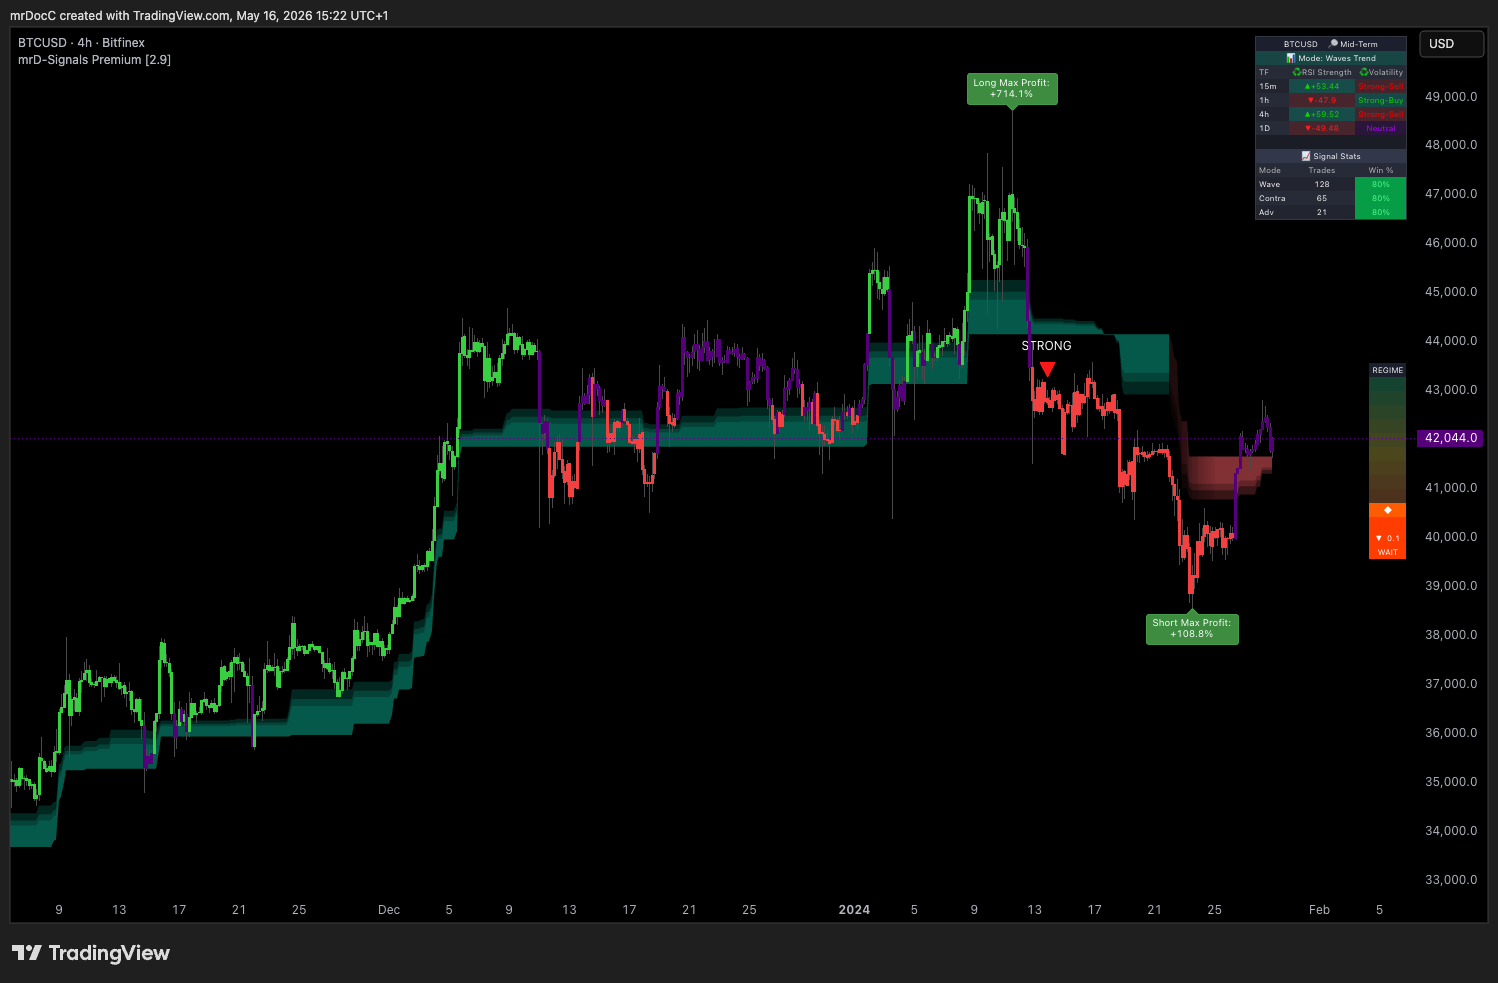
mrD-Signals Premium — seven-module signal engine
The biggest study in the suite. Seven internal modules share one chart and stay independent — you enable the ones that match your style and disable the rest:
- Wave Trend Signals — the default-on trend-entry engine, six filters in agreement before a triangle prints.
- Contrarian Signals — five-timeframe composite that hunts the extreme reversal points (peaks of long uptrends, valleys of long downtrends).
- Advanced Signals — multi-timeframe confluence filter on top of Wave Trend; STRONG vs NORMAL tiers.
- Trend Cloud — coloured regime cloud with three Fibonacci layers acting as dynamic support / resistance.
- RSI Band — momentum visualisation painted on price instead of a sub-pane, so you read momentum and price action with one eye-track.
- Trend Catcher — pullback hunter that fires on retests of a trailing line, anti-chop guarded.
- Key Level — auto-drawn POC, swing highs / lows and round numbers — only the levels you actually use.
A live statistics dashboard docked inside the chart tracks historical win rate per module on the current symbol / timeframe so you can see which modules fit which asset.
Full settings reference: mrD-Signals Premium.
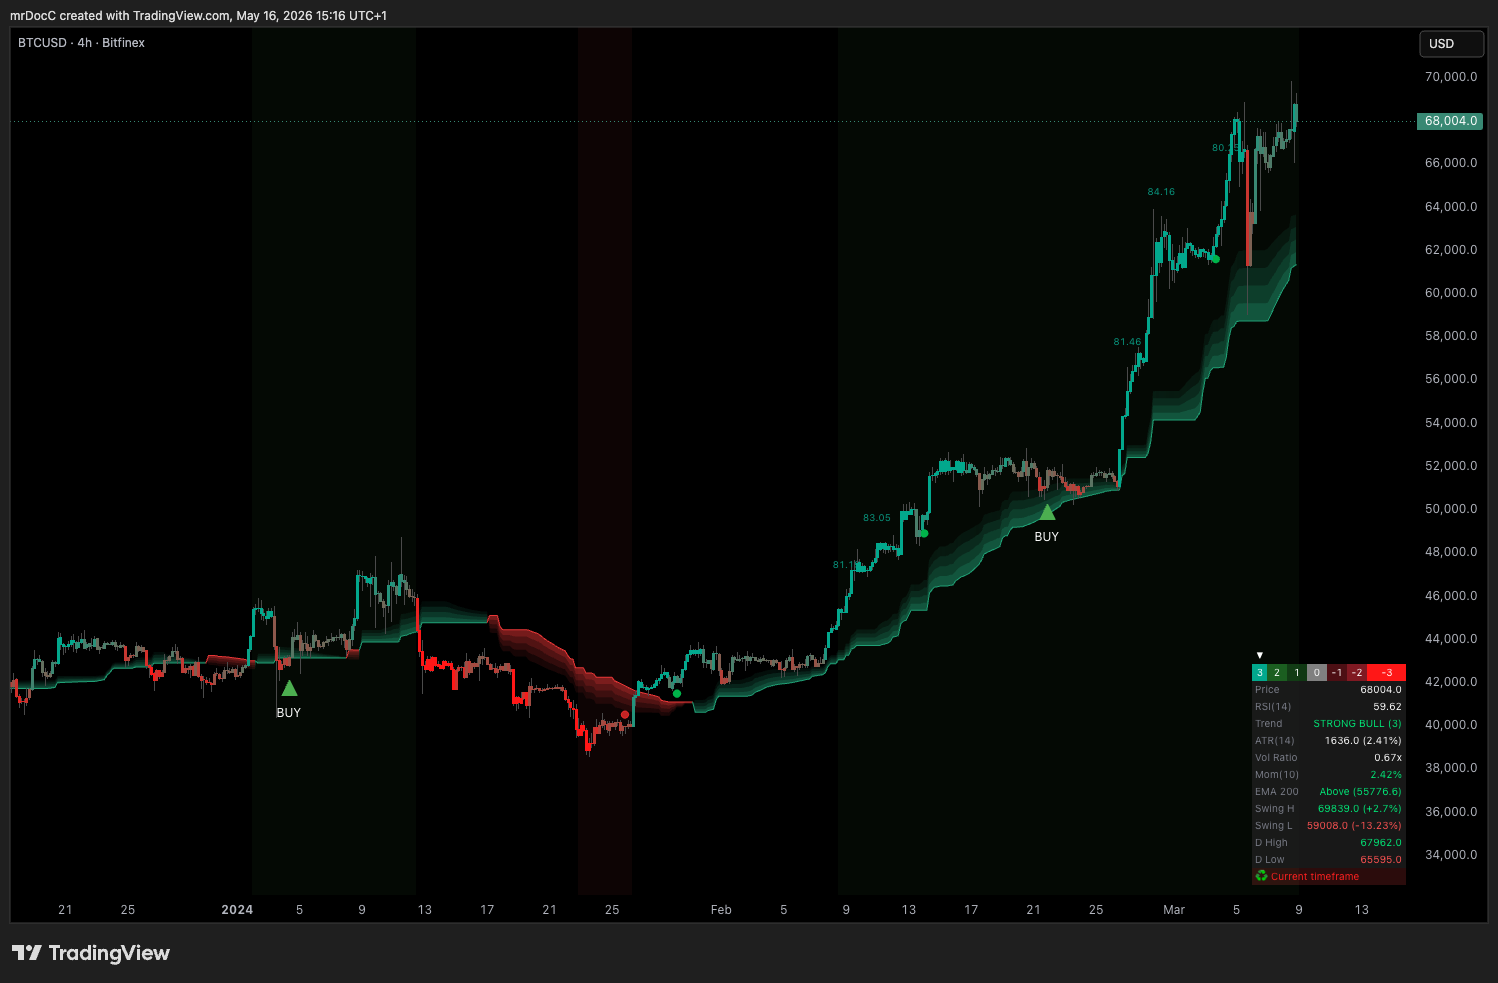
mrDAlgo Premium — trend-catcher with pullback alerts
A trend-following toolkit that wraps the chart in a single, opinionated read of direction. The study draws:
- A trend-catcher line plus coloured candles — green for active long regime, red for active short, purple for a neutral / transition zone.
- An EQ cloud that doubles as moving support / resistance, similar in spirit to an Ichimoku cloud.
- A configurable moving-average stack for confirming the larger-timeframe direction at a glance.
- S/R volume zones marking where the heaviest historical activity sits, so you have obvious targets and invalidation lines.
- BUY Pullback and Bullish / Bearish Trend Change alerts that ship with the exact symbol, timeframe, entry price, RSI value, and band-level reference inline — ready to forward to a webhook.
Use it as the trend dashboard when you want one chart to answer "are we trending and where is the next pullback worth taking?"
Full settings reference: mrD-RSI Pullback — the dedicated documentation set covers all eight modules (Pullback Signals, Advanced Pullback, RSI Band, Candle Coloring, Hidden Divergence, S/R Volume Zones, Info Table, Alerts), the 5-step workflow, and the 12 golden rules.
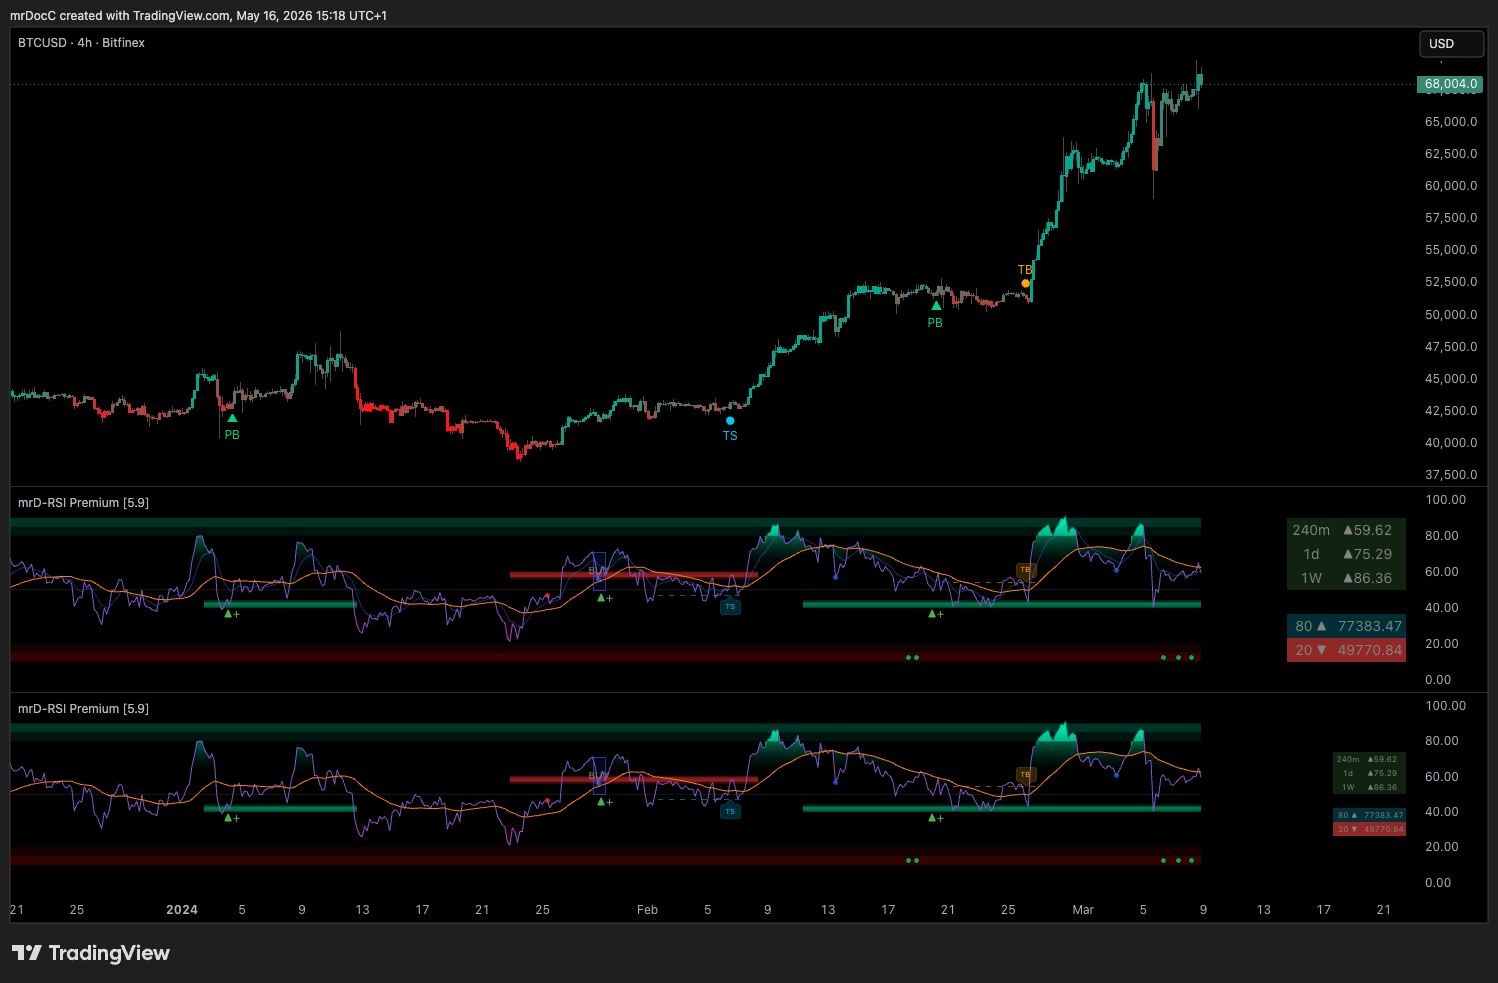
RSI Swing v2 Premium — the canonical RSI swing trader
A rewritten RSI built specifically for swing entries in crypto's higher noise floor. The study:
- Paints RSI in colour-zoned bands (overbought / extended / neutral / oversold) so you read regime at a glance, not numbers.
- Includes a multi-timeframe RSI table so you can see 1m / 5m / 15m / 1h / 4h / 1D RSI without flipping charts.
- Fires a Retest Buy when RSI returns from above 80 back through 50, and a Retest Sell when it returns from below 20 back through 50 — the highest base-rate RSI entry pattern.
- Adds an RSI Ichimoku-style cloud and divergence detection for the higher-quality swing setups.
Use it as the momentum filter that decides whether a Smart Ranges retest or an mrDAlgo pullback is worth taking.
Full settings reference: mrD-RSI Premium.
How access works
The TradingView platform handles distribution. You enable access in two steps:
- Link your TradingView username to your mrD-Indicators profile — paste the exact case-sensitive handle into the TRADINGVIEW NAME field on the Edit Profile dialog.
- Add the studies in TradingView — once your subscription is verified, the studies appear under Indicators → Invite-only scripts. Click each to drop it on the chart; star them as favourites for one-click loading on every chart.
Access is bound to your TradingView username — not your TradingView email and not your mrD-Indicators email. If you change your TradingView handle, update the profile field promptly or the distribution job will revoke access on the next reconciliation pass.
Full walk-through with screenshots: Link your account & add the studies.
How the TradingView suite relates to the rest of the platform
The TradingView studies are a delivery channel for our signal models — the underlying models live in our backend and are also consumed by:
- The Web App chart terminal (
/trading/chart-terminal) — the same Smart Ranges / RSI / signal logic, rendered natively into the mrD chart engine instead of inside the TradingView widget. - The Web App signal hubs (
/trading-signals/*) — a flat feed of every signal the composite model has emitted, with full historical performance. - The Auto Trade engine — the same composite signals routed to your exchange API.
Pick the TradingView suite if your daily workflow is already inside TradingView and you want minimum tool-switching. Pick the Web App if you want depth heatmap, footprint, liquidation overlays, and one-click execution alongside the same signals.
Where to go next
- Link your account & add the studies — paste your TradingView name into the profile, then add the studies from Indicators → Invite-only.
- TradingView workspace setup — strip the chrome, retune the six chart-settings tabs, and lock the layout.
- TradingView alerts — set push / email / webhook alerts on the mrD signals so you stop babysitting the chart.
- Chart Terminal overview — see how the same signal models look inside our native terminal.
- Delta DSL Script — build your own indicators inside the Web App if you have a setup TradingView does not let you express cleanly.
- Charting Library introduction — embed the same engine in your own product.