Getting Started
Install and configure mrD-RSI Pullback in under five minutes — TradingView install steps, recommended preset tables per trading style (day-trader, swing trader, position / DCA, ultra-short scalper), settings per asset class (crypto, forex, stocks, gold), the first 3 trade steps, the 30-second pre-entry checklist, and the six most common beginner mistakes.
This page is the install + configuration walkthrough for mrD-RSI Pullback. After the install steps, four preset tables cover the canonical trading styles (day-trader, swing, position, scalper), four asset-class blocks tune the presets for crypto / forex / stocks / gold, and a hands-on "first 3 trade steps" section gets you trading the same day.
If you have just landed on this page from the overview, the path is: read the install steps below, pick the preset matching your style, apply it once, then read Pullback Signals to understand the core entry engine.
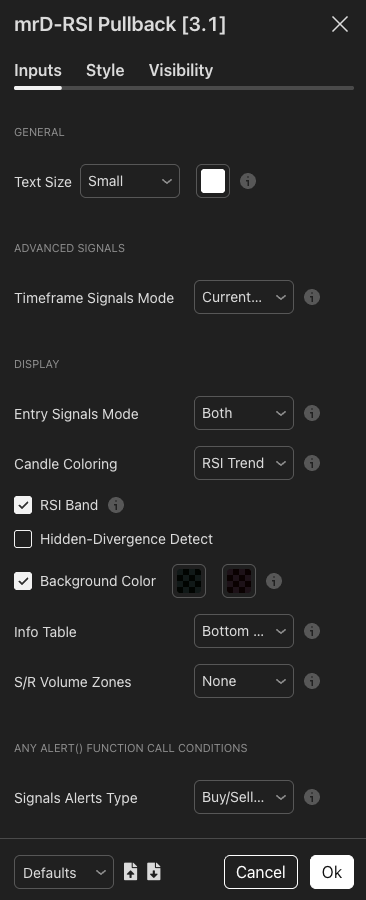 The indicator's setting panel as it looks immediately after install. The preset tables below this section tell you which values to pick per trading style.
1. Install the indicator
Three steps. Takes under a minute.
Step 1 — Add to chart
- Open TradingView → Indicators (shortcut
/). - Search:
mrD-RSI Pullback→ click to add to chart.
For access flow on invite-only studies see Link your account & add the studies.
Step 2 — Open Settings
Click the gear icon next to the indicator name on the chart panel. The input panel opens to the right.
Step 3 — Apply the preset matching your style
See the four preset tables below — pick the one that matches how you trade. Apply once, then leave the settings alone for at least a week to get used to how the study behaves.
2. Recommended settings per trading style
Four canonical configurations. Pick exactly one — do not mix-and-match values across presets, the modules are tuned to work together within each profile.
A) Day-trader — 5m to 15m timeframe, ~5–20 trades per day
| Setting | Value | Why |
|---|---|---|
| Timeframe Signals Mode | Current timeframe | Fast reaction, no HTF lag. |
| Entry Signals Mode | Both | Catch both longs and shorts. |
| Candle Coloring | RSI Trend | Quick momentum reading. |
| RSI Band | On | Mandatory filter — only trade with cloud bias. |
| Hidden-Divergence Detect | Off | Too noisy at low TF. |
| Background Color | On | Clear OB / OS warning. |
| Info Table | Bottom Right | Quick RSI / Vol monitoring. |
| S/R Volume Zones | S/R Volume | Precise TP / SL levels. |
B) Swing trader — 1H to 4H timeframe, ~5–15 trades per week
| Setting | Value | Why |
|---|---|---|
| Timeframe Signals Mode | 1h & 4h or 4h & D | Multi-TF confluence is critical for swings. |
| Entry Signals Mode | Both | Catch both directions. |
| Candle Coloring | RSI Trend or None | Aesthetic preference. |
| RSI Band | On | Required. |
| Hidden-Divergence Detect | On | Confirms trend continuation. |
| Background Color | On | OB / OS context. |
| Info Table | Bottom Right | Dashboard. |
| S/R Volume Zones | S/R Volume | Critical for swing TP placement. |
C) Position trader / long-term DCA — Daily / Weekly
| Setting | Value | Why |
|---|---|---|
| Timeframe Signals Mode | D & W or D & 3D | Macro alignment. |
| Entry Signals Mode | BUY (longs only) or Both | DCA accounts usually long-only. |
| Candle Coloring | None or RSI Trend | Less critical on high TF. |
| RSI Band | On | Required. |
| Hidden-Divergence Detect | On | Extremely valuable on high TF. |
| Background Color | On | Daily / weekly extremes worth flagging. |
| Info Table | Bottom Right | Dashboard. |
| S/R Volume Zones | S/R Volume | DCA entry zones. |
D) Ultra-short scalper — 1m to 5m
| Setting | Value | Why |
|---|---|---|
| Timeframe Signals Mode | 5m & 15m | Minimum confluence to filter whipsaw. |
| Entry Signals Mode | Both | Both directions. |
| Candle Coloring | RSI Trend | Critical for scalp. |
| RSI Band | On | Required. |
| Hidden-Divergence Detect | Off | Too much noise. |
| S/R Volume Zones | None | Less meaningful at low TF. |
Scalping is the hardest profile — only enter when three factors align: signal + cloud + bar confirmation. If any one is missing, skip.
3. Settings per asset class
The presets above are timeframe-driven. The notes below add asset-class-specific tuning on top of the preset.
Crypto — BTC / ETH / altcoin spot and futures
- Recommended TF: 15m, 1H, 4H for swing.
- Settings: use the Swing trader (1H–4H) preset mostly.
- Note: crypto has very strong wick spikes → prefer Advanced Signals (multi-TF) over standalone Pullback.
- Flexible TP: use S/R Volume Zones as profit-taking zones.
Forex — major pairs (EUR/USD, GBP/USD, USD/JPY)
- Recommended TF: 15m–1H intraday, 4H–D swing.
- Settings: enable
Hidden-Divergence Detect = On— Forex tends to continue trends cleanly after pullbacks. - Note: avoid trading during major news (NFP, FOMC) — the indicator does not handle fundamental shocks.
Stocks / indices — SPX, NDX, large caps
- Recommended TF: 1H–D.
- Settings: Swing trader preset.
- Note: indicator works best with highly liquid stocks (> 500K avg daily volume). Penny stocks may produce noise.
Gold / commodities — XAU, OIL
- Recommended TF: 15m–4H.
- Settings: Swing trader preset, enable S/R Volume Zones.
- Note: gold is very trendy — Pullback signals are extremely effective when the cloud is clearly green / red.
4. Your first 3 trade steps — hands-on
After setup, try this workflow on a chart you know well. It is the same workflow professional traders run a thousand times a year — only the asset and the size differ.
Step 1 — Observe the RSI Band cloud direction (15 seconds)
- Cloud is green → bias is LONG → only look for BUY signals.
- Cloud is red → bias is SHORT → only look for SELL signals.
- Cloud is flipping colour constantly → market is sideways → do not trade.
Step 2 — Wait for a Pullback Signal to fire (be patient)
- A ▲ BUY appears BELOW the bar → long entry signal after the pullback completes.
- A ▼ SELL appears ABOVE the bar → short entry signal after the pullback completes.
- Never trade against the cloud — skip SELL when cloud is green, skip BUY when cloud is red.
Step 3 — Place SL / TP and manage
- SL — below the most recent swing low (long) or above the most recent swing high (short). If an S/R Volume Zone exists nearby, place SL just outside that zone.
- TP1 — R:R 1:1 → close 30–50% of position.
- TP2 — R:R 1:2 or at the opposite S/R zone → close the rest.
- Trailing — after TP1, move SL to break-even.
Never enter full size at once. Split 50/50 to give yourself room to course-correct.
5. 30-second pre-entry checklist
Run this every time. If two or more items are missing, do not enter.
- RSI Band cloud matches the signal direction.
- Info Table does NOT show "Go to {TF}" warning (you are on the right TF for trading).
- Volume Ratio ≥ 0.8× (sufficient liquidity, not a thin print).
- No major news within the next 30 minutes.
- Estimated R:R ≥ 1:1.5.
- Total risk of this trade ≤ 1–2% of account.
The indicator filters for you; the final call is yours.
6. Common beginner mistakes
The six mistakes that catch every new user. Recognise them in your own workflow and fix them.
| Mistake | Consequence | How to avoid |
|---|---|---|
| Entering immediately when RSI hits OB / OS | Chasing top / catching knife | Wait for a Pullback Signal to fire — do not guess. |
| Ignoring the RSI Band cloud | Trading against trend → constant stops | The cloud is filter #1 — never skip. |
| Entering during sideways | Many small consecutive stops | Cloud flipping constantly → stand aside. |
| Setting SL too tight | Getting stop-hunted | SL outside the nearest S/R Volume zone. |
| No clear TP plan | Diamond hands → losing winners | Set TP the moment you enter. |
| Taking every signal | Burnout + overtrading | 2–3 quality setups per day is enough. |
7. Next steps
- The full reference for the core entry engine: Pullback Signals.
- The 12 golden rules for maximum win rate: Winrate Tips.
- The 12-row context dashboard: Info Table.
- Back to the study overview: mrD-RSI Pullback.
Final tip
Paper-trade at least 50 trades before going live. The indicator is just a tool — your context-reading skill is what generates profit. The 50-trade paper benchmark is what separates traders who keep their capital from traders who do not.