Chart Settings dialog
Tune candle colors, background, fonts, crosshair, timezone, price-axis behaviour, and position overlays in the seven-tab Chart Settings dialog. Where each tab lives and what it actually toggles.
The Chart Settings dialog is where you tune everything about how the chart looks — candle colors, background palette, fonts, crosshair, timezone, price-axis chrome, and on-chart position markers. It is not the place for indicator settings, trade controls, or alerts — each of those has its own dialog. This page is the map: which tab covers what, what each control actually changes, and how persistence works.
Opening the dialog
Two ways:
- Click the gear icon in the top toolbar.
- Right-click anywhere on the chart canvas → Chart settings…
The dialog opens as a draggable frosted-glass panel — grab the ⋮⋮ handle in the top-left of the header to move it. Click × in the top-right or click outside the panel to dismiss.
The seven tabs
Left rail on desktop, horizontal scrollable strip on mobile.
| Tab | What lives there |
|---|---|
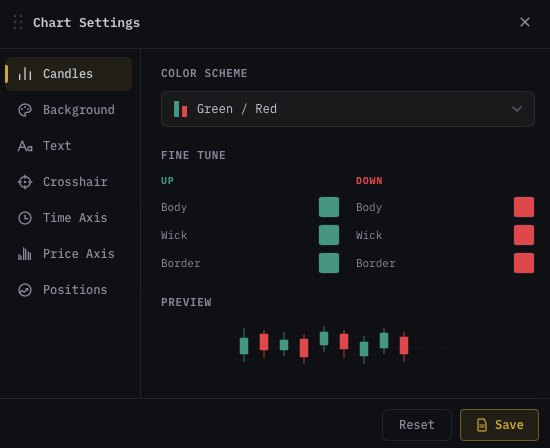
| Candles | Color Scheme preset dropdown, per-piece (body / wick / border) fine-tune for UP and DOWN candles, live preview. |
| Background | Dark / Light theme, background preset dropdown (solids + gradients), custom background color, gradient toggle, grid lines, centre-of-chart watermark. |
| Text | Font size for legend, price-axis labels, and general chrome — with a Quick Size shortcut row (S / M / L / XL). |
| Crosshair | Crosshair color, line style (dashed / solid / dotted), width, and Magnet mode (Off / Weak / Strong). |
| Time Axis | Timezone picker — controls the X-axis tick labels and the status-bar clock. |
| Price Axis | Last-price line (on/off + dash style), Y-axis auto-scale, session levels (SH / SL / PDC). |
| Positions | On-chart overlay toggles for live Positions and Open Orders. |
Candles tab
The most-touched tab. Three groups:
Color Scheme
Sixteen presets in a single dropdown — Teal/Red, Green/Red (default), Lime/Crimson, Blue/Orange, Cyan/Pink, Gold/Purple, Sky/Rose, Mint/Coral, Emerald/Ruby, Amber/Indigo, Neon, Pastel, Mono White, Binance, Bybit, TradingView Light. Each row shows two stacked bars in the preset's bull/bear hex so you can scan-pick by colour rather than by name.
Picking a preset overwrites all six fine-tune values (UP body / wick / border + DOWN body / wick / border).
Fine Tune
Two columns side by side — UP (bull) on the left, DOWN (bear) on the right. Each column has three rows: Body, Wick, Border, each with a colour swatch that opens the project's color picker. The column header is tinted with the live body colour so you can see at a glance what each side currently paints.
Adjusting any fine-tune swatch implicitly drops the active "Color Scheme" selection to Custom until you pick a preset again.
Preview
A small SVG strip of mixed bull and bear candles, painted with the current Fine Tune values. Updates in real time as you adjust swatches — no chart reload needed.
Background tab
Theme
Dark vs. Light. Toggling here flips the whole app — chart, side panel, bottom panel, settings dialogs, scanners, account pages — not just the chart canvas. The Candles / Background / Grid defaults swap to the matching light or dark presets when you flip.
Background
Fourteen presets in a dropdown:
- Solids: Pure Dark, Charcoal, Navy, Midnight, Slate, White, Snow, Cream.
- Gradients: Deep Space, Ocean, Aurora, Ember, Twilight, Forest. (Marked with a
gradientchip in the dropdown.)
Picking a preset writes its bg, bgGradientEnd, and grid colours at once and flips the Gradient toggle as appropriate.
Custom
- Background — colour picker + live hex readout for the start colour.
- Gradient — switch. When on, the dialog reveals an End Color picker and the chart background becomes a
linear-gradient(135deg, start, end).
Grid Lines
- Horizontal — toggle horizontal gridlines on/off.
- Vertical — toggle vertical gridlines on/off.
- Color — one picker drives both H and V (they always share a colour by design). Defaults match the active background preset.
Watermark
A pro-terminal centre overlay that paints SYMBOL · TF faintly behind the candles (Bookmap / TradingView-Premium style).
- Show symbol · TF — master toggle.
- Opacity — stepper, 2% → 30% (default 6%). Discreet by design.
- Size — stepper, 50% → 200% of the auto-derived height (~14% of pane height). The label is clipped to the chart area so 200% on a small pane won't bleed into sub-panes.
Text tab
Font sizes for three surfaces in the chart chrome.
Font Size
Three steppers:
- General — every chrome label except the legend and price-axis ticks (range 8–18 px, default 11).
- Legend — the symbol · TF · price legend in the top-left of each pane (range 8–18, default 11).
- Price Axis — the right-side price tick labels (range 8–16, default 10).
Quick Size
Four shortcuts — S (9), M (11), L (13), XL (15). Picking one writes all three steppers in lockstep (Price Axis = General − 1 so axis labels stay slightly tighter than the legend).
Preview
A miniature legend + axis + value row painted at the three current sizes so you can compare without leaving the dialog.
Crosshair tab
Crosshair
- Color — picker + hex readout.
- Style — three-button row: Dashed, Solid, Dotted.
- Width — three-button row: 1 px, 2 px, 3 px.
Magnet
Snap mode for the crosshair while drawing or hovering — three options:
- Off — free crosshair, no snapping.
- Weak — vertical line locks to the candle centre.
- Strong — vertical line locks to candle centre AND horizontal line snaps to the nearest Open / High / Low / Close on the hovered bar.
The current mode is wired into the WASM engine via bridge.setCrosshairMagnet — it applies to every interaction (hover, drawing, alert placement, "+" affordance).
Preview
Crosshair + sample candles rendered at the current colour / style / width.
Time Axis tab
Timezone
A grid of curated timezone tiles — UTC, Exchange (where applicable), and major regions (New York, London, Tokyo, Hong Kong, Sydney, Dubai, Singapore, etc.). Each tile shows the IANA name and the geographic region. The selected timezone has a check icon.
The choice controls two surfaces in lockstep:
- The X-axis tick labels on every pane.
- The clock cell in the status bar.
Current
Three read-only rows showing:
- Time — the live wall-clock time in the selected zone.
- Zone — the short name (e.g.
EST) and full IANA id (America/New_York). - UTC offset — the current offset, including DST shifts.
DST transitions re-broadcast as they happen, so a chart left open across the spring/autumn changeover will move its labels by ±1 hour at the precise moment the rule kicks in.
Price Axis tab
Settings that apply to the right-side price axis chrome, not the candle paint itself.
Last Price Line
A horizontal dashed line painted at the last close, colored by direction vs. the previous close (green when up, red when down).
- Show line — master switch. When off the line is skipped entirely from the render pass (zero per-frame cost — useful on slow machines).
- Line width — stepper, 0.5 → 2.5 px (step 0.5).
- Dash length — stepper, 1 → 10 (step 1).
- Gap length — stepper, 1 → 10 (step 1).
The line direction tracks the close-vs-previous-close, not the bar open — a green candle that closed lower than the prior bar still gets a red last-price line, matching how exchange tickers behave.
Y-Axis Auto-Scale
- Auto-scale Y — when ON, the chart fits the visible candle range to the price axis every frame. Drag-zooming on the Y axis flips this OFF automatically (same UX as TradingView's
Atoggle on the price scale). Toggling back ON refits to the current view.
Session Levels
- Show SH / SL / PDC — dashed anchor lines at the session high, session low, and previous-day close, with floating right-side tags. The day boundary uses the timezone picked in the Time Axis tab; the lines re-anchor at local midnight and the PDC carries yesterday's settle into today's session.
Positions tab
On-chart visualisation of your manual and auto-trade positions. Same data source as the Trades & Orders indicator — toggling them here also flips the indicator's overlay.
On-Chart Overlays
- Positions — entry / TP-hit / SL-hit circular markers anchored to the bar where each event happened. Green disc = BUY entry, red disc = SELL entry,
1/SL/TPnumerals inside. - Open Orders — horizontal dashed lines + right-edge labels for entry, TP1/TP2/TP3, and SL on every currently-open position or pending limit. Each line is coloured by side (green for BUY-side prices, red for SELL-side prices) and the entry line carries the live unrealised P&L badge.
Preview
A miniature candle strip with the markers and lines painted exactly as they appear on the live chart — useful for previewing how the toggles will read against a busy chart.
Footer — Reset / Save
- Reset — restores all seven tabs to their theme defaults (
DARK_DEFAULTSif dark,LIGHT_DEFAULTSif light). No per-tab reset. - Save — commits and closes the dialog. Changes are also auto-applied to the chart as you make them (no Apply round-trip needed), but Save persists them to local storage so they survive a reload.
Persistence
Settings are stored in localStorage under the key chart_appearance_settings — per browser, not per account.
Practical consequences:
- Switching to a different machine or browser → you get the default theme on first load. Re-apply your preferred preset there.
- Clearing site data wipes the settings; the next load falls back to defaults for the active theme.
- The position/order overlay toggles (Positions tab) used to live in this same key but are now owned by the Trades & Orders indicator settings — a one-time migration moves the flags across automatically the first time you open the dialog after the May-2026 refactor.
Defaults — what the dialog ships with
| Field | Dark default | Light default |
|---|---|---|
| Candle body / wick / border (UP) | #089981 (Green/Red preset) | #089981 |
| Candle body / wick / border (DOWN) | #F23645 | #F23645 |
| Background | #111111 (Pure Dark preset) | #FFFFFF (White preset) |
| Grid lines | #262635 | #E0E3EB |
| Crosshair color | #9598A1 | #9598A1 |
| Crosshair style / width / magnet | Dashed / 1 px / Off | Dashed / 1 px / Off |
| Font size — general / legend / axis | 11 / 11 / 10 px | 11 / 11 / 10 px |
| Last-price line | Enabled (1 px, 4-dash, 4-gap) | Enabled |
| Y-axis auto-scale | On | On |
These are the values Reset writes back. Picking the Binance preset in Color Scheme gets you #0ECB81 / #F6465D (the canonical exchange palette) — different from the dialog default.
Common questions
I changed crosshair colour but the line still looks the same.
You probably picked a colour very close to the gridlines or background. Bump the contrast — #9598A1 (default) is the lowest-contrast colour that still reads on both themes; for a brighter crosshair try #FFD740 (amber) or #42A5F5 (sky).
Magnet feels too aggressive when drawing across a long range. Switch from Strong to Weak. Strong snaps both axes to OHLC values, which is great for placing horizontal lines exactly at an open/close but distracting when you're sketching a trendline across 100+ bars. Weak only locks the vertical to candle centre — much more forgiving.
My background is custom but the dropdown still says "Custom" — that's expected?
Yes. The dropdown label shows the active preset name OR "Custom" when no preset matches the current bgColor + grid + gradient triple. Picking any preset will re-overwrite the custom values.
Light theme looks washed out after I customised the dark candle colours.
Flipping themes calls Object.assign(settings.value, LIGHT_DEFAULTS) — your custom dark colours are NOT carried across. The two palettes are intentionally independent so a high-saturation neon scheme tuned for OLED doesn't bleach out on a daylight LCD. Customise each theme separately.
Timezone is set to New York but the autotrade signal timestamps show UTC. The autotrade card has its own timestamp format that's pinned to UTC for audit clarity. The chart X-axis and status-bar clock will follow this setting; everything money-related stays UTC.
Session levels lines don't appear. Either the toggle is off, or the symbol's day boundary hasn't crossed yet (a freshly-loaded chart with no prior-day data shows nothing until midnight rolls over). The PDC will appear at the next session boundary.
What's next
- Chart types — the chart-type selector is in the toolbar, not in this dialog.
- Indicator panel basics — each indicator has its own settings dialog opened from the panel cog, NOT from here.
- Layouts — multi-pane setups each remember their own appearance state.
- Status bar & tooltips — the status-bar clock cell reads its timezone from this dialog's Time Axis tab.