Footprint Settings
Full reference for the Footprint Settings dialog — General tab (palette, font size, volume unit, volume coloring), Detection tab (stacked-imbalance mode, ratio, min rows, max age), Display tab (cell highlights, bracket markers, retest ray, profile, delta strip).
The Footprint Settings dialog controls everything from how cells look to how the stacked-imbalance overlay is detected and drawn. Open it by clicking the cog icon next to the Footprint chart-type selector in the top toolbar. The dialog has three tabs: General, Detection, Display. Every change applies live as you make it — Save just closes the dialog.
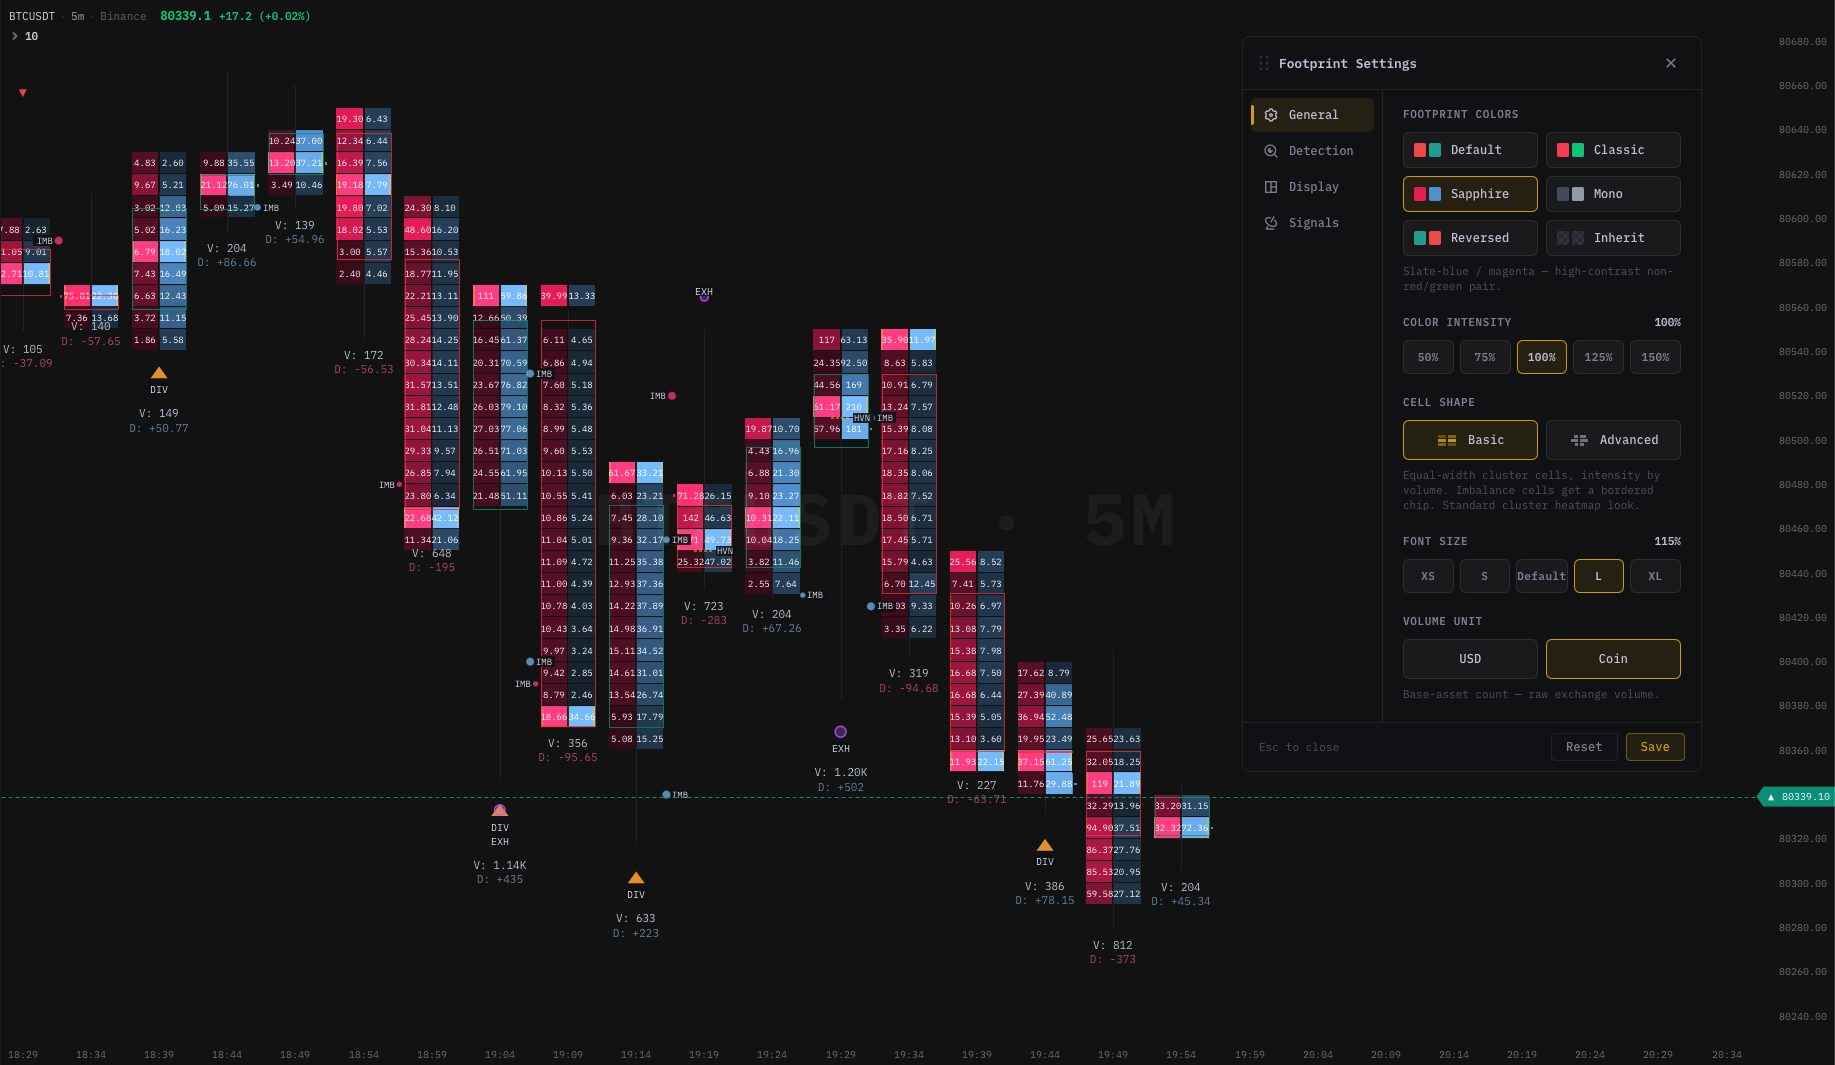
General tab
Settings here affect all three footprint modes (Bid×Ask, Delta, Volume).
Candle Palette
Lets you retint the footprint cells without touching the global candle colours in Chart Settings.
| Palette | Bull side | Bear side |
|---|---|---|
| Classic | Teal-green | Project red |
| Vivid | Bright green | Project red |
| Bright | Leaf green | Orange-red |
| Neon | Electric green | Hot pink |
| Mono | Light grey | Mid grey |
| Reversed | Red-orange | Green |
Changing the palette here only applies while Footprint is the active chart type. Your Chart Settings candle colours are unchanged — switch back to a candlestick chart type and your normal palette returns.
Color intensity
A slider that scales the alpha (opacity) of every cell tint. Default sits in the middle.
- Lower intensity — cells become more translucent, the chart looks calmer, the spine and price gridlines come through.
- Higher intensity — cells become saturated, every bar pops, easier to read across a wide chart.
Tune to your monitor brightness. Most users settle on slightly-below-default for dark theme and slightly-above-default for light theme.
Font Size
Scales the numbers printed inside cells.
| Label | Effect |
|---|---|
| XS | Smaller — good for high-density charts with many rows. |
| S | Slightly smaller than default. |
| Default | Standard cell text. |
| L | Larger — helpful on hi-DPI displays. |
| XL | Very large — for low-resolution screens. |
If numbers seem to disappear at any size, zoom in (wider bars) first before increasing font size. The chart hides text automatically when a cell is too narrow to fit it cleanly — increasing font alone won't help if the cell is the limiting factor.
Volume Unit
Controls whether the numbers shown in cells represent USD notional or raw coin size.
| Option | What the number shows |
|---|---|
| USD | Notional — quantity × last close price. |
| Coin | Raw base-asset volume from the exchange. |
USD is the default for crypto because most traders think about flow in dollar terms. Use Coin if you prefer to match raw exchange data, or you trade an asset where USD conversion doesn't add meaning. Switching units triggers a full footprint rebuild, so allow a brief moment for the chart to reload.
Volume Coloring
Only applies when the chart-type dropdown is set to Footprint — Volume. Has no effect on Bid×Ask or Delta modes.
| Option | What it means |
|---|---|
| Mono | All bars use a single neutral hue; alpha scales with volume size. More volume = more solid. |
| Delta-tinted | Bar width still follows volume size, but the hue shifts toward the bull or bear colour depending on whether net delta was positive or negative at that price. |
Use Mono when you want to read where size was without a directional signal inside the bar (three modes = three distinct visual identities). Use Delta-tinted if you want directional context kept inside the volume bars.
Detection tab
Controls the Stacked Imbalances feature — automatic detection of price clusters where one side was significantly more aggressive across several consecutive rows. For the full reading guide see Stacked Imbalances.
Stacked Imbalances (master toggle)
Switches the entire stacked-imbalance feature on or off.
- Off (default). No zone detection runs. The chart shows standard footprint cells with no imbalance highlights or bracket markers.
- On. The chart computes zones and draws highlights, brackets, and rays depending on your Display tab settings.
Turning this on has a small one-time cost when first enabled — the engine scans recent history. During normal markets that cost is invisible; on very long lookbacks (hundreds of bars at a small tick size) you may see a brief pause.
Mode
How the ratio between the two sides is measured at each row.
| Option | Rule |
|---|---|
| Diagonal | Compares aggressive buys at this price to aggressive sells at the price one tick below (and sells to buys one tick above). Industry-standard definition. |
| Horizontal | Compares buy vs sell at the same price. Looser definition — more zones, often noisier. |
Diagonal is the default and the definition most professional footprint tools use. Switch to Horizontal only if you specifically prefer a wider net.
Ratio
How lopsided one side must be relative to the other before a row counts as imbalanced.
| Preset | Ratio | Character |
|---|---|---|
| Default | 250% | Most sensitive — more zones. |
| Standard | 300% | Slightly stricter. |
| Strict | 500% | Only strong imbalances. |
| Extreme | 1000% | Very rare, high-conviction only. |
You can also drag the slider freely between 250% and 1000%. Higher ratio = fewer but cleaner zones. Lower ratio = more zones but more noise. Start at Default or Standard and tighten if you find zones appearing on every bar.
Min Rows in Stack
The minimum number of consecutive imbalanced rows required to form a detected stack zone.
Options: 2 / 3 / 4 / 5 / 6. Default is 3.
A zone that spans only one row is isolated noise — requiring at least 3 consecutive rows filters most single-tick accidents out. Raise to 4–6 on high-liquidity instruments where 3-row stacks are common.
Max Age
How many bars back the engine keeps displaying detected zones.
| Option | Behaviour |
|---|---|
| All | Zones stay visible until price re-tests them (or no age limit). |
| 50 / 100 / 200 | Hide zones older than this many bars on the active timeframe. |
Use All on longer-term timeframes where old imbalances may still matter. Use a bar cap on short timeframes (e.g. 1m scalping) to avoid cluttering the chart with zones from hours ago.
Display tab
Controls what the overlay draws once detection finds a zone. These settings do not trigger a re-scan — they are purely visual.
Cell Highlights
When on (default), every imbalanced cell inside a detected stack is tinted:
- Left side (aggressive sellers) — red tint.
- Right side (aggressive buyers) — green tint.
- Cells that are part of a qualified stack get a stronger tint than isolated single-row imbalances.
Turn off if you only want the bracket markers and/or retest ray without the per-cell colour overlay.
Stack Bracket
When on (default), a small bracket marker appears at the origin candle for every detected stack:
]on the right edge → a bullish (buying) stack.[on the left edge → a bearish (selling) stack.
The bracket is compact — three short lines — and stays anchored to the candle where the stack formed. It does not move with price.
Retest Ray
Off by default. When turned on, a horizontal line extends from the zone's origin candle forward in time until price re-tests the zone level.
Sub-options (only relevant when the ray is on):
- Keep Filled Rays. After price re-tests the zone, the ray continues in a faded style instead of disappearing. Useful for reviewing how many zones were eventually retested.
- Origin Box. Draws a shaded rectangle behind the origin candle's stack range, making the source zone easy to spot when scrolling history.
The retest ray is an advanced visual suited to traders who use inefficiency-based markup. If you find it adds clutter, leave it off and rely on Cell Highlights + Stack Bracket alone.
Show Profile
Toggles the side profile panel on the right of the chart. The profile shows the same footprint data with its own scaling, anchored to the active (or latest) bar. See Display modes — side profile.
Show Delta Strip
Toggles the per-bar delta strip below the chart — a histogram of bar delta across the visible range, optionally with a cumulative line. See Display modes — per-bar delta strip.
Signal markers
Per-kind toggles for the six signal types — ABS / IMB / DIV / EXH / UA / HVN. Each can be turned on or off independently. See Signal markers for what each one means.
POC marker
A separate small control in the Display tab toggles how the POC is drawn:
| Option | Appearance |
|---|---|
| Off | No POC marker — only the cell hue indicates which row is the POC. |
| Glow | A subtle highlight behind the POC cell. |
| Ticks | Two small tick marks at the edges of the POC row. |
| Both | Glow + ticks. |
Default is Both for maximum visibility. Reduce to Ticks or Glow if you find the POC marker over-saturating the chart.
Reset and Save
- Reset — reverts every setting to its default. Greyed out when you are already at defaults.
- Save — closes the dialog. All changes are already applied live as you make them; Save is just a confirm-close.
What's next
- Display modes — Bid×Ask vs Delta vs Volume in detail.
- Stacked Imbalances — what the detection tab actually does.
- Signal markers — what each
ABS/IMB/DIV/EXH/UA/HVNtag means. - Reading & analysis — workflow once you've picked settings.
- Tips & best practices — calibration heuristics for tick size and ratio.