Introduction
A focused scripting language for writing custom indicators that run inside the mrD chart engine. Vector math, drawing primitives, alert hooks — same canvas, same render loop, same coordinate system as the built-in indicators.
Delta DSL is a domain-specific language for writing custom indicators that run inside the chart engine — same canvas, same render loop, same coordinate system as RSI, MACD, VRVP and the rest of the built-in catalog. It exists for one job: let quant authors encode a setup that nothing in the catalog plots, then publish or share that script as a first-class indicator.
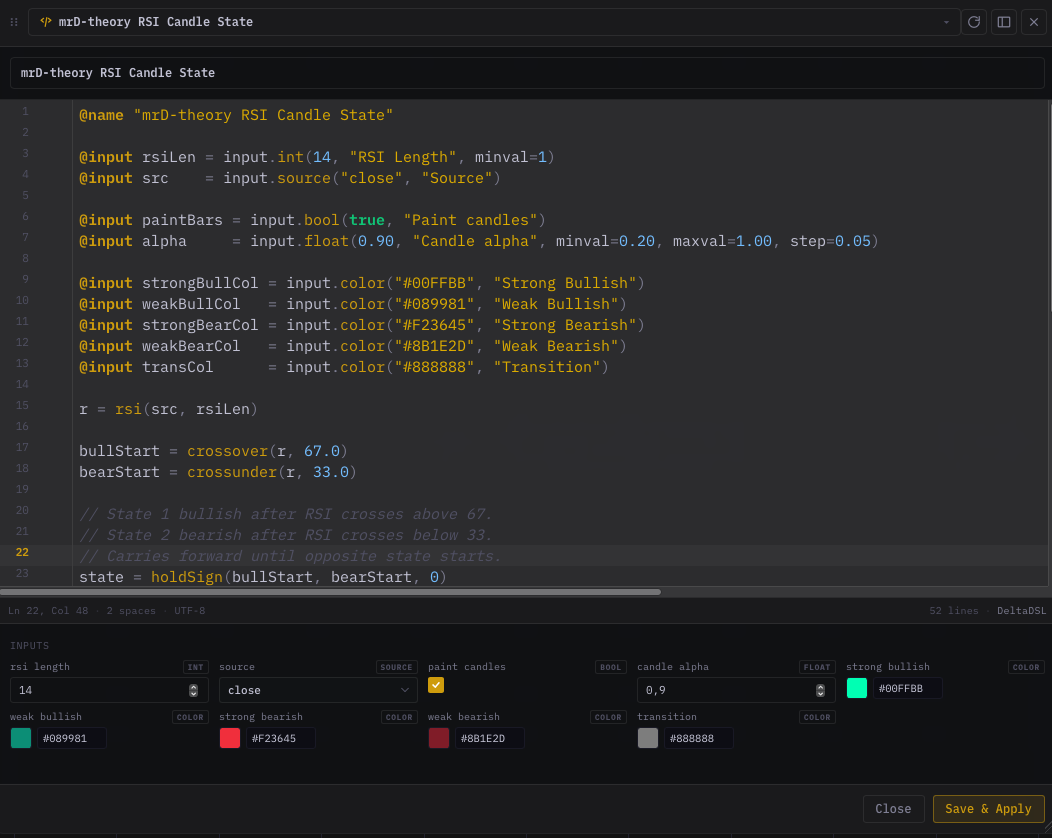 The Delta DSL editor: type a script on the left, watch it render on the live chart on the right — same canvas, same render loop, same coordinate system as the built-in indicators.
The language is small on purpose. Vectorised math, a typed @input system, a drawing primitives library, control flow (if / for / fn), and an alert hook. No network access, no DOM, no module imports — every script runs in a closed sandbox with hard caps on iterations, recursion depth, and draw records. That sandbox is what lets the chart host author-submitted scripts safely (alongside the TradingView studies suite as our two paid distribution channels).
Reading order
If you're new to Delta DSL, walk these in order:
- Getting started — install nothing, type a five-line script, see it on the chart.
- Language reference — syntax, types, operators, comments.
- Control flow —
if/for/fnblocks. - Inputs & directives —
@name,@pane,@input. - Built-in variables —
open,high,low,close,volume,time,bar_index. - Math & format — element-wise math, branching helpers, string / time formatting.
- Series operations —
shift,change,crossover,valuewhen, … - Indicators —
sma,rsi,macd_hist,atr,supertrend, … - Statistics —
stdev,correlation,linreg,polyreg2,zscore. - Drawing — every plot / box / label primitive.
- Panes — putting your indicator in its own sub-window.
- Alerts — wiring
alertconditioninto push, Telegram, in-app. - Debugging —
logInfo/logWarning/logErrorand the Logs panel. - Versioning & migration — what happens to old scripts when we ship a new version.
- Recipes — copy-paste cookbook.
- Pitfalls — limits, sandbox, performance.
If you already know Pine Script, skim the language reference (most syntax transfers) then jump straight to recipes.
Mental model in 90 seconds
A Delta DSL script is a single body that runs once per chart redraw. The runtime provides:
- The OHLCV vectors of the visible window:
open,high,low,close,volume, plustime(epoch ms) andbar_index. - The parameter values the user set in the per-indicator settings panel — everything you declared with
@input. - A standard library of math, series, indicator, statistics, color, time, format, and drawing functions.
You build one or more derived vectors, then call drawing functions (plotLine, plotBand, plotHline, plotShape, labelNew, …) to render them. The engine takes care of:
- Re-running the script when the user pans, zooms, or scrolls to a new window.
- Wiring your
@inputdeclarations to the settings dialog with the right widget (slider, number input, dropdown, color picker, source picker). - Painting your draw calls into the chart canvas at native speed.
- Lifting
alertconditiondeclarations into the alert builder so the user can fire push / Telegram / in-app notifications when your condition is true.
A first script
@name "Trend Filter"
@pane "overlay"

@input length  = input.int(50, "Length", minval=2, maxval=500)
@input upColor = input.color("#0ECB81", "Bull color")
@input dnColor = input.color("#F6465D", "Bear color")

ma     = sma(close, length)
bullMa = mask(ma, close >= ma)
bearMa = mask(ma, close < ma)

plotLine(bullMa, color=upColor, width=1.5)
plotLine(bearMa, color=dnColor, width=1.5)
plotShape(crossover(close, ma),  close, shape="arrowUp",   color=upColor, size=8)
plotShape(crossunder(close, ma), close, shape="arrowDown", color=dnColor, size=8)

alertcondition(crossover(close, ma),  title="Trend flip up",   message="Trend flipped up on {{symbol}}")
alertcondition(crossunder(close, ma), title="Trend flip down", message="Trend flipped down on {{symbol}}")
What you get on the chart:
- A 50-period moving average painted on the price (because
@pane "overlay"). - The line color swaps between two user-tunable colors every time price crosses it.
- Up / down arrow markers on every crossover bar.
- Two alert conditions wired into the alert builder.
The settings dialog auto-builds itself from the three @input declarations — a length slider clamped between 2 and 500, plus two color pickers. No UI code anywhere.
The four building blocks
1. @input directives
Every knob you want to expose lives at the top of the script as an @input declaration. The grammar supports seven typed builders — input.int, input.float, input.bool, input.string, input.source, input.color, input.price — plus a literal-default shorthand. Each input can declare minval / maxval / step clamps, an options= enum for dropdowns, and a label so the settings panel stays readable.
See Inputs & directives.
2. Vector math and series helpers
The standard library exposes the operations real indicators need:
| Family | Examples |
|---|---|
| Math | abs, sqrt, pow, log, exp, min, max, clamp, lerp, iff, mask, nz, fixnan |
| Series | shift, prev, change, crossover, crossunder, valuewhen, barssince, highest, lowest, sum, cum, rising, falling |
| Moving averages | sma, ema, wma, rma, hma, dema, tema, vwma |
| Oscillators | rsi, stoch_k, stoch_d, cci, mfi, willr, mom, roc, macd_line, macd_signal, macd_hist |
| Volatility | tr, atr, bb_basis, bb_upper, bb_lower, kc_*, dc_* |
| Volume | obv, ad, cmf, pvt |
| Structure | pivothigh, pivotlow, pivotAvg, supertrend, supertrend_dir, plus_di, minus_di, adx |
| Statistics | stdev, variance, correlation, linreg, polyreg2, polyreg2_stderr, percentrank, percentile, median, normalize, zscore |
| Time | year, month, dayofmonth, dayofweek, hour, minute, second, weekofyear |
| Format | tostring, padLeft, padRight |
| Color | rgb, rgba, withAlpha, gradient |
You compose them like any vectorised array library. There is no per-bar ceremony — the runtime applies operations across the whole window in one pass. When you DO need a scalar loop (e.g. iterating over the last 20 bars to find swing pivots and draw individual lines), the for block lets you do it without leaving the language.
3. Drawing primitives
Drawing happens through dedicated functions, never by mutating canvas state. You call them, the engine records them, and the renderer flushes them on the next paint.
Per-bar plots (one shape / line per bar of the visible window):
plotLine,plotDashedLine,plotBand,plotCandleplotHline,plotDashedHlineplotShape,plotMarkerUp,plotMarkerDown,plotChar,plotText,plotBgColor
World-coordinate primitives (anchored to a (timestamp, price) pair — pan and zoom with the chart):
plotLineXY,plotVLine,plotBox,plotLabel,plotPolyline,plotPolygon,plotArrow
Persistent slot-based primitives (reuse the same drawing across frames by passing a stable string slot name):
labelNew,boxNew,lineNew,polylineNew
Drawing-tool primitives (script-owned shapes that look and behave like user-drawn objects — right-click delete, grip-drag, snap-to-bar):
drawingTrendline,drawingHline,drawingFibRet,drawingChannel
Pane-only primitives (only draw inside @pane "below" sub-windows):
paneLine,paneDashedLine,paneHline,paneBand,paneFill,paneCandle,paneLabel,paneRange,paneHeightpanePlotLine,panePlotVLine,panePlotBox,panePlotLabel
See Drawing for the full reference.
4. Alert conditions
alertcondition(cond, title, message, frequency) registers a trigger. The user wires it from the per-indicator alerts dialog the same way they wire built-in indicator alerts; firings land in the Web App alerts inbox (and Telegram if linked).
See Alerts.
What you can build
| Pattern | Example |
|---|---|
| Overlay on price | Custom moving averages, support / resistance bands, range boxes, markers on candles |
| Sub-pane indicator | Your own RSI variant, divergence detectors, volume-weighted oscillators, anything that wants its own y-axis |
| Signal layer | Long / short markers with calibrated stop and target prices |
| Alerting | Cross / threshold / divergence rules that fire push, Telegram and in-app notifications |
| Annotation overlay | VWAPs anchored to events, fib auto-projections, persistent box / label HUDs |
Anything that fits into "compute a vector or a few vectors from OHLCV, then plot or alert on them" is in scope. Anything that needs to read network data, persist state across bars in a custom way, or call out to a third-party API is intentionally out of scope.
The sandbox — what you cannot do
A Delta DSL script runs in a closed runtime by design. The following are blocked at the language level — there is no escape hatch and no roadmap to add one:
- Network access of any kind (
fetch,XMLHttpRequest, WebSockets). - Reading browser globals (
window,document,localStorage, cookies). - Loading or evaluating arbitrary code (
eval, dynamic imports, function constructors). - Spawning workers or loading WebAssembly modules.
The runtime also enforces hard caps so a buggy or malicious script cannot freeze the page:
| Cap | Limit | What it protects |
|---|---|---|
| Loop budget | 5 000 000 iterations per script invocation | Runaway loops |
Single for ceiling | 1 000 000 iterations | Pathological inner loops |
| Recursion depth | 64 frames | Deep fn recursion |
| Draw records | 50 000 records | One frame painting a million markers |
These caps are generous enough that every indicator we have written in-house fits comfortably under them — but they are firm. Hitting one halts the script cleanly, logs a warning to the indicator panel, and leaves the chart responsive.
See Pitfalls for the full sandbox spec.
Where Delta DSL fits the rest of the platform
- Authored in the Web App at
/trading/chart-terminalvia the Script Editor dialog (open from the indicator catalog). - Saved per-account; runs across every chart pane you open.
- Shareable as a script bundle — the same bundle works on every chart instance because the runtime is identical everywhere.
- Same alert pipeline as built-in indicators — firings land in
/trading/alertsand stream to Telegram.