Indicators — overview
The chart engine ships 22 native indicators plus a Custom Script host. This page maps the catalog by family, explains the per-indicator settings dialog shape, plan locks, and how to combine indicators without slowing the chart.
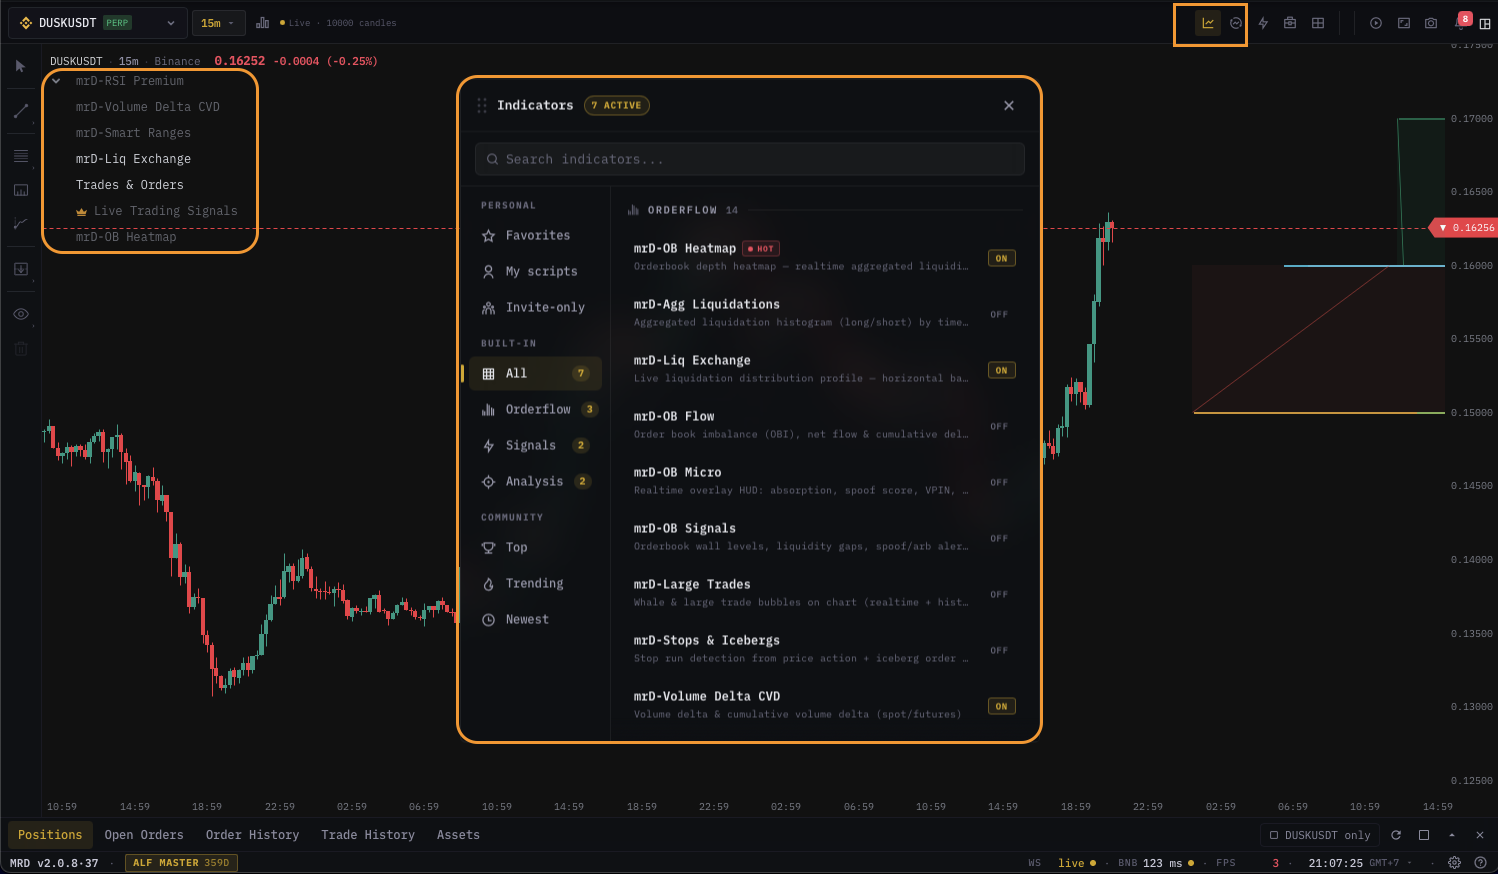
The chart engine ships 22 native indicators across five families plus the Custom Script host that runs your own DeltaDSL scripts. Every indicator opens from the same catalog dialog and surfaces in the indicator panel strip above the chart. This page is the catalog map — what's in each family, which indicators are free vs. plan-locked, and how to stack them without thrashing the chart's frame-rate.
The 23 indicator pages
| Family | Indicators |
|---|---|
| Price & momentum | RSI · EMA · Volume · CVD · CVD Profile |
| Liquidity & heatmap | Orderbook Heatmap · Liquidation Heatmap · Liquidations by Exchange · Aggregated Liquidations · Large Trades |
| Volume structure | VRVP · VPIN · TPO · Trades & Orders |
| Derivatives | Open Interest · OI / CVD Pattern · Funding · Forex Sessions |
| Specialty | Smart Ranges · mrD Pullback · Live Signals · Custom Script |
How the per-indicator dialog is laid out
Every indicator's settings dialog uses the same shape. Once you know the shape you can navigate any of the 22 dialogs without re-learning the UI:
| Section | What it controls |
|---|---|
| Inputs | Numeric parameters — lookback periods, lengths, thresholds. Stepper widgets with min / max enforced. |
| Display | Where the indicator paints — overlay on the candle chart vs. its own sub-pane below — plus per-element show/hide checkboxes. |
| Style | Colors, line widths, line styles (solid / dashed), fill, marker shapes. Theme-aware. |
| Signals | When the indicator emits triggers (BUY / SELL chips, dots, divergence markers). Often plan-locked — see "Plan locks" below. |
| Alerts | Wire this indicator's triggers into the unified alerts inbox. |
| Presets | Save and reload your tuned settings as a named preset. |
Open from the cog icon on the indicator's row in the panel strip, or from the Settings button on the catalog card.
Stacking — what plays well together
A trader rarely runs more than 6-8 indicators at once. Some indicators duplicate signal — pick one per concept:
| Concept | Pick one |
|---|---|
| Momentum oscillator | RSI or the RSI block inside Live Signals — not both. |
| Volume read | Volume or CVD — CVD shows direction, Volume shows magnitude. Most traders pick one. |
| Volume profile | VRVP or TPO or CVD Profile — they paint the same axis with different aggregations. |
| Liquidity / depth | Orderbook Heatmap overlay or Tick · Heatmap chart type — both render depth, one as an overlay on candles and one as the chart itself. |
| Derivatives bias | Funding or OI — Funding shows price-side flows, OI shows positioning. Both is fine. |
Pair specialty indicators (Smart Ranges, mrD Pullback, Live Signals) with one momentum + one volume — they already include their own confluence logic.
Per-pane vs. global
By default settings are per pane. Two panes both running RSI can use 14-period on one and 21-period on the other. A small globe icon on a setting indicates global — changing it on one pane updates every pane (heatmap color preset, for example).
Performance considerations
Every active indicator runs against every tick. Stacking 8+ heavy indicators on sub-minute TFs will drop your frame-rate. The expensive ones:
- Orderbook Heatmap — re-paints the heatmap canvas on every depth message.
- Liquidation Heatmap — re-aggregates on every liquidation event.
- Tick · Heatmap chart type + Orderbook Heatmap overlay = double work. Pick one.
- Custom Script with a long lookback or heavy
forloop.
The cheap ones (RSI, EMA, MACD, Volume) you can stack freely without measurable cost.
What's next
- Indicator panel basics — how to enable, focus, mute, delete.
- Pick an indicator from the table above to read its full settings reference.
- Custom Script — write your own indicator in DeltaDSL.