Candle Coloring
Candle Coloring is the bar-tinting layer inside mrD-Signals Premium — paints every candle by the active signal mode's regime engine so traders read trend / sideways at a glance without consulting other indicators. Three colours total — green, red, purple — and three auto-selected engines (Waves / Advanced / Contrarian).
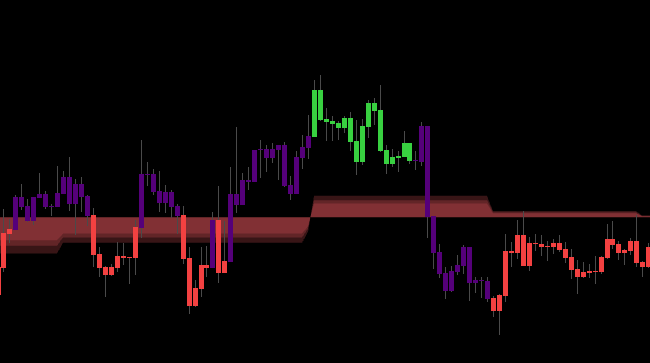
Candle Coloring paints every candle body by the trend logic of the currently active signal mode. At a glance you read three things — which side of the trend you are on, whether the trend is healthy or weakening, and whether you are in a sideways regime where signals tend to fail. The goal is simple: instead of needing to consult five indicators to identify regime, the candle colour alone is enough.
 Candle bodies tinted by the active mode's regime engine. The eye reads "trend on / trend off" without leaving the price action.
The palette — three colours total
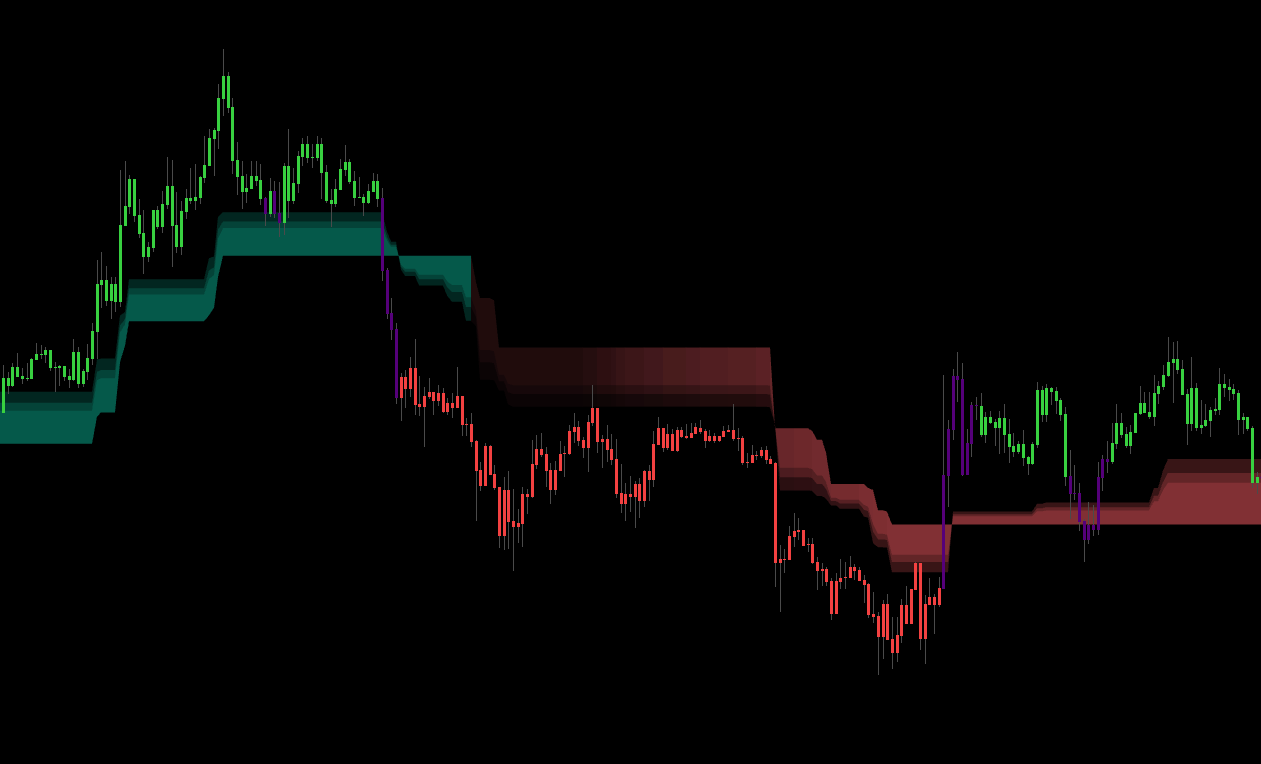 Three colours: green = bullish regime, red = bearish, purple = sideways. The fourth state (no colour) means the module is off or the mode is set to None.
| Colour | Meaning | Recommended action |
|---|---|---|
| Green | Trend logic is bullish — buyers winning | Prefer LONG, avoid counter-trend SHORT. |
| Red | Trend logic is bearish — sellers winning | Prefer SHORT, avoid counter-trend LONG. |
| Purple | Neutral / sideways — no clear trend | Do NOT enter — wait for a clear regime. |
| No colour | Mode = "None" or Candle Coloring is off | — |
Golden rule. If a candle is purple, even if a signal triangle fires, you should skip it — the market is consolidating and signals during this period tend to fail.
The three colouring engines — auto-selected by signal mode
Each signal mode has its own colouring engine tuned to be consistent with the mode's own signal logic. You do not pick the engine — the module automatically applies the right one when you switch modes.
Engine A — Waves Trend mode
Uses the chart timeframe's Wave Trend filter:
- Green when price is above the filter line AND momentum is rising.
- Red when price is below the filter line AND momentum is falling.
- Purple when price chops around the filter (sideways sign).
Characteristics. Fast-reacting on the chart TF — suits scalp / day-trade. May flip colour during short pullbacks; that is normal fast trend-following behaviour.
Engine B — Advanced (MTF confluence)
Requires chart TF AND HTF (higher timeframe) to agree before changing colour:
- Green when both chart TF AND HTF are bullish.
- Red when both chart TF AND HTF are bearish.
- Purple when the two timeframes disagree.
Characteristics. Highly stable — colour rarely flips, only changes when both timeframes confirm a new trend. Suits swing / position trading. When a candle transitions from purple → green / red in this mode, it is a very strong regime change signal.
Engine C — Contrarian mode
Uses a composite trend score combining EMA fast / slow + RSI50 + position vs support / resistance:
- Green when the composite score leans bullish.
- Red when the composite score leans bearish.
- Purple when the score is near zero (regime unclear).
Characteristics. For counter-trend traders — colour tells the main flow so you know which direction to fade.
Five colour patterns to learn
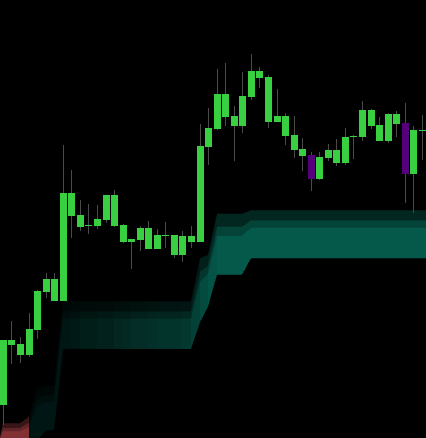
Pattern 1 — continuous colour sequence
 Continuous green run: strong trend, no noise. Optimal condition to hold and trail.
G G G G G G G — strong trend, no noise. The optimal condition to hold positions and trail stops. If you are in a trade, hold. If not, enter on the first pullback to EMA or Trend Cloud.
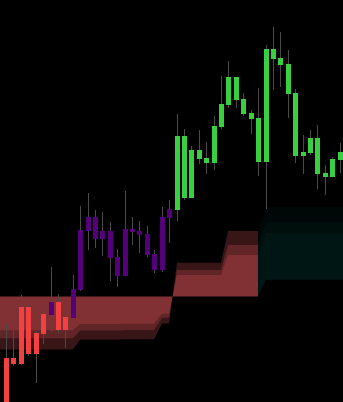
Pattern 2 — colour flip
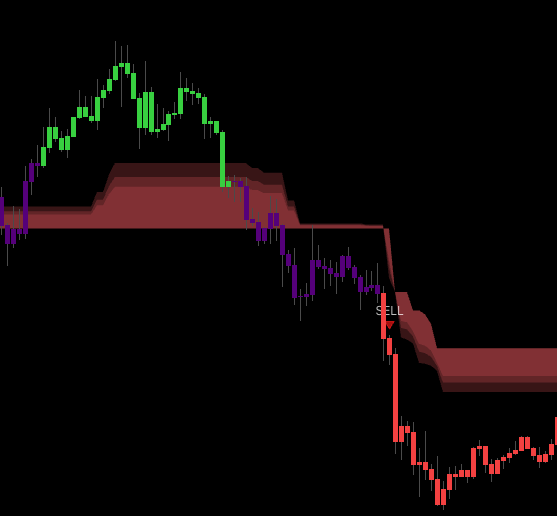 Red run → purple transition → green start. Regime change in progress; wait 2 – 3 confirming candles before entering.
R R R R → P → G G G G — regime change in progress. Old trend ended, new one forming. Wait for 2 – 3 same-colour candles before entering. Acting on the first flip risks a fake.
Pattern 3 — choppy colours
 Alternating colours mean the market is sideways / whipsawing. Stand aside.
G R G R P R G P — market is sideways or whipsawing. Signals during this phase have low quality. Do not trade. Wait for the market to pick a direction.
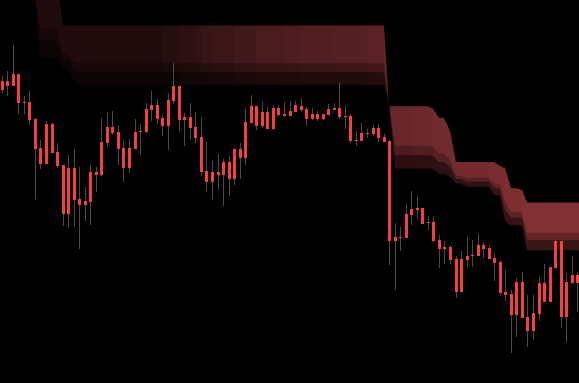
Pattern 4 — purple cluster
 A long purple stretch after a green run means the old trend is losing momentum. Consider TP.
G G P P P P P P — old trend losing momentum, preparing for regime change or extended sideways. If in a position, consider TP (especially in Advanced mode). Wait for a clear signal before reversing.
Pattern 5 — counter-colour single
 One red inside a green run = normal pullback, not a reversal. Entry opportunity with the main trend.
G G G G R G G G — single counter-colour bar inside a same-colour run. Normal pullback, not a reversal. Entry opportunity with the main trend; limit order at the low of the counter-colour candle or at the nearest EMA.
Combining candle colour with signals
When a signal triangle fires, check the candle colour at that bar:
| Situation | Rating | Action |
|---|---|---|
| BUY ▲ + green candle | A+ | Full size, reasonable leverage acceptable. |
| BUY ▲ + purple candle | B | Half size, require extra confirmation from Trend Cloud. |
| BUY ▲ + red candle | C — likely fake | Skip — fighting market pressure. |
| BUY ▲ + 3 prior candles all green | A+ | Trend clearly established; confident. |
Simple rule. Triangle matches candle colour → enter. Mismatch → skip.
Triple confirm = highest-quality setup
The cleanest read combines the signal triangle, the matching candle colour, and a matching Trend Cloud:
▲ BUY signal + green candle + green Trend Cloud
   → A+ entry, full size, reasonable leverage acceptable
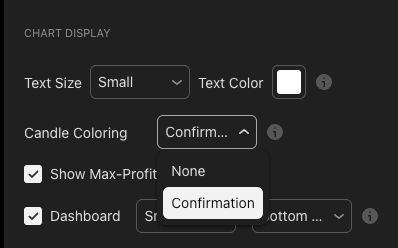
How to enable / disable
In the indicator's input panel:
General Settings → Candle Coloring
  • Confirmation  → On (default)
  • None          → Off
Keep Confirmation on in 99% of cases. Only turn off if running many other indicators and looking to reduce visual noise.
Common questions
Q. Why are candles often purple even when I see price trending? Three possible reasons:
- Engine B (Advanced) requires HTF agreement. Chart bullish but HTF still bearish / sideways → purple.
- Trend is weakening — momentum is fading; hasn't flipped red yet but isn't strong enough to be green.
- Deep pullback — price is testing EMA or the Trend Cloud's base.
Q. Candle colours flip constantly — how do I trade? You are in a chop zone — that is good news. The module is telling you not to trade. Switch to another asset or wait for the market to pick a direction.
Q. Engine A and Engine B show different colours on the same chart? Correct — by design. Engine A is faster and may already be green; Engine B is slower (requires HTF) and may still be purple or red. That is why Advanced is higher quality but fires less often.
Q. Can I customise the colours? In the current build, colours are fixed to ensure consistency across traders (same visual language). No custom option is available.
One-line cheat sheet
GREEN  candle = buyers  → prefer LONG, no SHORT
RED    candle = sellers → prefer SHORT, no LONG
PURPLE candle = sideways → DO NOT TRADE
Rule #1. Never trade against the candle colour. That is the fastest path to a drawdown spike.
Where to go next
- Waves Trend Signals — the default signal engine; Engine A pairs with this mode.
- Advanced Signals — Engine B pairs with this mode for the MTF-confirmed colour.
- Contrarian Signals — Engine C pairs with this mode and reads the composite score.
- Trend Cloud — the regime cloud that combines with the candle colour for triple confirm.
- Overview — back to the study overview.