Footprint — reading & analysis
A practical workflow for reading the footprint. Anchor on structure first, read the current bar top-down, relate the footprint to the wick and body, walk multi-bar context, then combine with the heatmap, CVD, and volume profile.
This page is a practical read map for the footprint — what to look at first, how to relate rows to candle structure, and how to combine footprint detail with the rest of the terminal. Memorise the five-step workflow and you'll get a useful read out of any footprint chart in under thirty seconds.
Step 1 — Anchor on structure
Before reading numbers, mark:
- Trend / bias on your trading timeframe (or explicit "no trade" if the chart is in chop).
- Key levels — prior day high / low, VWAP, obvious support / resistance, range boundaries.
- Volatility — wide-range bars need wider ticks or aggregation; very quiet markets may need finer ticks.
The footprint confirms or challenges your structural idea. It rarely replaces it.
Step 2 — Read the current bar top-down
Range and POC
- Scan where the POC sits relative to the bar's open and close.
- Close near the high with supportive delta (more aggressive buying in the lower half of the bar) often interests long-biased flow readers.
- Close near the low with selling dominant in the upper half often interests short-biased readers.
Treat single-bar patterns as hypotheses until the next bar confirms (continuation) or fails (reversal / trap).
Stacked imbalances
When several adjacent prices show the same side dominating (e.g. repeated large bid-initiated prints without proportional asks), the chart can flag them as a Stacked Imbalance zone.
- In a trend — stacks in the trend direction may show continuation pressure.
- Against a level — e.g. into resistance with stacked sells above; watch for rejection or absorption (Signal markers).
Thin vs thick areas
- Thick levels = high participation → potential magnet or battleground on retest.
- Thin levels = low trade interest → price may move through quickly (an "air pocket") unless new liquidity appears.
Step 3 — Relate footprint to the wick and body
| Area | Typical questions |
|---|---|
| Upper wick | Did sellers aggress into buyers' lift? Any absorption — large opposite-side volume without continuation? |
| Body | Where is value building? Does delta support the close? |
| Lower wick | Did buyers defend with aggressive lifts? |
If price pierces a level on thin volume and reverts, some traders label it a liquidity grab or stop run — the footprint helps quantify the aggression at the excursion prices, instead of just guessing from candle shape.
Step 4 — Multi-bar context
- Compare this bar's POC to the previous bar's POC. Rotation of POC can mark a short-term balance shift.
- Watch the delta-mode footprint across several bars for persistent one-sided delta (trend of aggression) vs choppy two-sided trade.
- Align with higher timeframe — a bullish footprint on 1m into daily resistance still faces a larger auction constraint.
Step 5 — Combine with other tools
| Tool | Combination |
|---|---|
| Orderbook Heatmap | See where liquidity was; the footprint shows what actually traded. The pair is the most complete order-flow read available. |
| CVD / CVD Profile | Session-wide bias vs per-bar footprint detail. |
| TPO / VRVP | Longer-horizon value vs intra-bar footprint. |
| Walls panel | Wall lifecycle context — when a wall pulls right before a stacked imbalance fires, that's a coordinated read. |
| Live Signals | Higher-timeframe named signals on top of the bar-by-bar footprint detail. |
Language precision
A few terms get misused. Use these definitions consistently — they make your own reading sharper.
- Footprint describes traded volume, not limit orders that never filled. Resting liquidity lives in the Orderbook Heatmap, not in the footprint cells.
- "Buyers strong" in flow terms means aggressive buys (market and IOC lifts), not "every participant is bullish".
- Always note session (Asia / Europe / US) and news. Flow patterns change under event risk, and a footprint pattern that's reliable in US-cash hours can be junk during Asia thin-book.
A 30-second template
When you flip onto a footprint chart for the first time on a given bar:
- Glance the higher-timeframe candle context — what's the trend on the higher TF.
- Find the bar's POC. Where is it relative to open / close?
- Is bar delta confirming the close or contradicting it?
- Are there stacked-imbalance zones nearby (tinted)? Bracket markers?
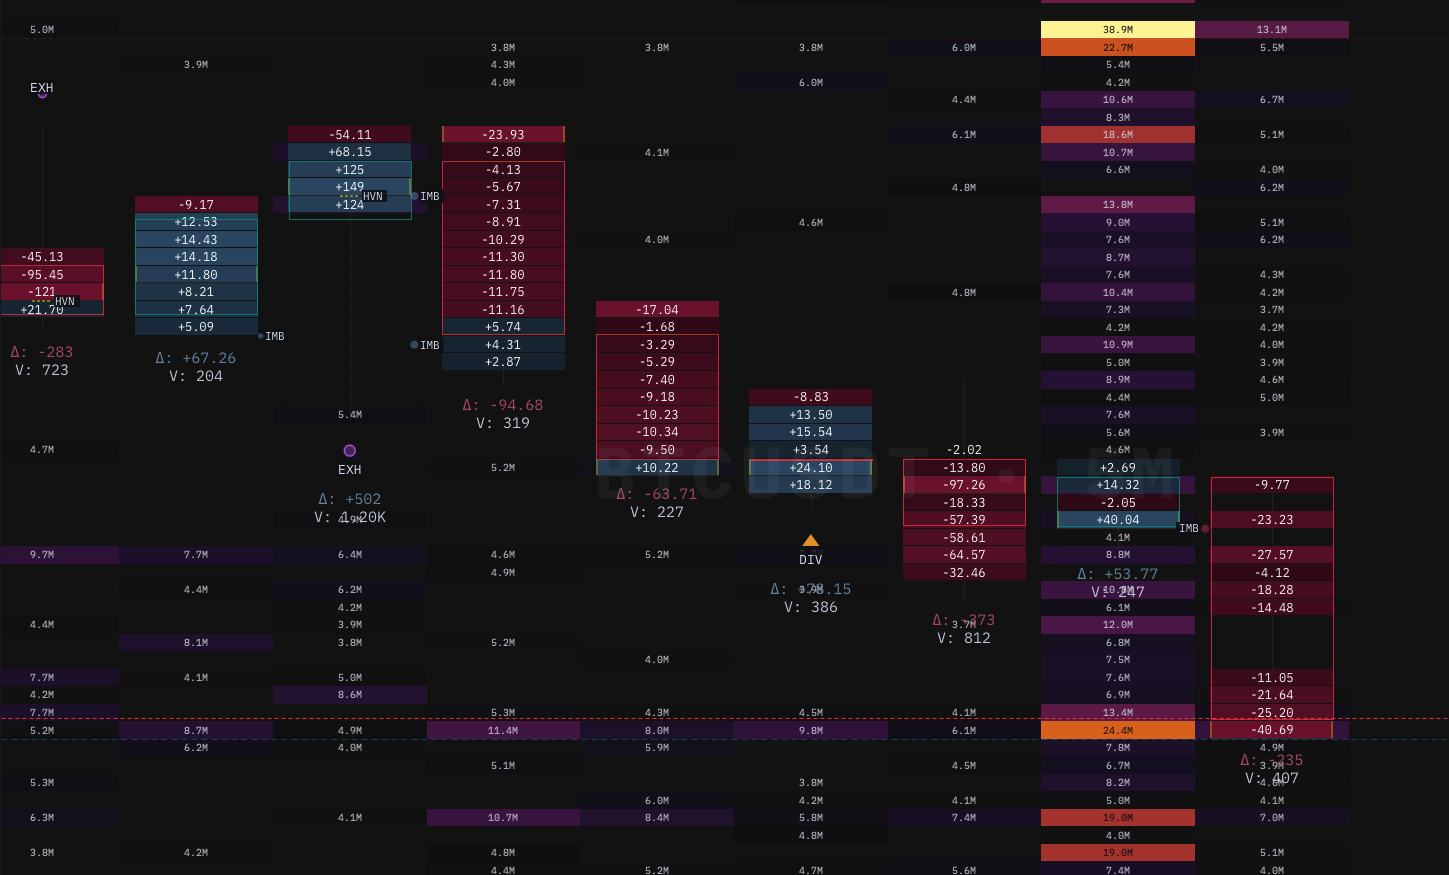
- Any signal tags on this bar —
ABS/IMB/DIV/EXH/UA/HVN?
You don't need to act — you just need to describe what you see. If you can't put the bar into one sentence, you're not reading it yet.
What's next
- Tips & best practices — tick size, zoom, common mistakes that ruin reads.
- Signal markers — what each
ABS/IMB/DIV/EXH/UA/HVNmeans. - Stacked Imbalances — the multi-row overlay that shapes step 2.
- Display modes — switching mode when one becomes unsuitable for a regime.
- Orderbook Heatmap — the canonical pair-with for the footprint.
- Replay mode — practice the workflow on historical bars without risking capital.