RSI Band
RSI Band is the macro bias layer inside mrD-Signals Premium — a slow self-adapting 3D cloud painted on the price chart that tells you which side of the market is winning in the long run. The hard-rule filter every trade must respect; against the cloud colour, you skip.
RSI Band is the longest, most stable trend layer inside mrD-Signals Premium — the macro filter painted directly on the price chart. Do not confuse it with the traditional 0–100 RSI oscillator in a sub-pane: this RSI Band is a 3D cloud on price whose only job is to tell you which side of the market is winning in the long run.
The principle is simple: against RSI Band colour, you do not trade. Green = longs only, red = shorts only. Disciplined traders who follow that single rule remove a large share of their worst losers automatically.
 RSI Band is a 3D cloud on price, not an oscillator. Width = trend strength; anchor line = macro invalidation.
What this module does
- Slow on purpose. It does not try to catch every move; its job is to not be wrong.
- Few flips. Once it picks a side, it tends to hold for a long stretch.
- Self-adapts to the timeframe. No manual tuning required.
- 3D depth. Densest at the edge far from price, fading toward price.
- Built-in noise filter. Requires multi-bar confirmation before flipping.
Mental model: if Trend Cloud is the heartbeat and Trail Cloud is the skeleton, RSI Band is the general. Rarely issues orders, but when it does, you listen.
Visual anatomy
 Anatomy: near edge fades with momentum, middle gradient = 3D depth, far edge = densest core, thin anchor line = macro invalidation.
- Far edge (anchor line) — densest, the trend anchor. The visible thin line is the final reference point. Breaking it = the trend has flipped at the macro level.
- Middle — gradient depth, gives the 3D feel.
- Near edge — faded; the gradient ties to momentum (denser when price is running far from the anchor, fading as price returns toward it).
Colour palette
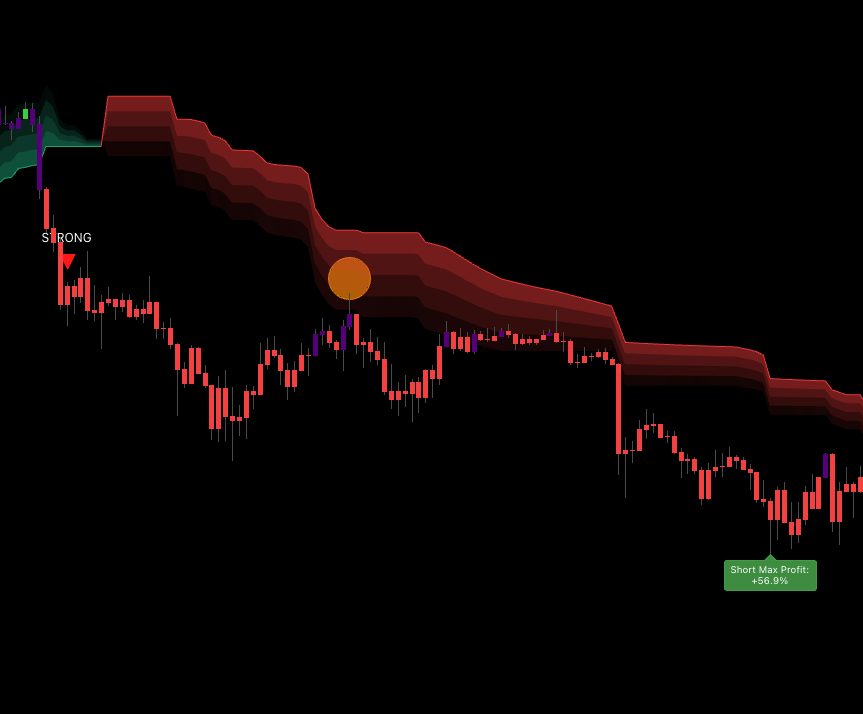
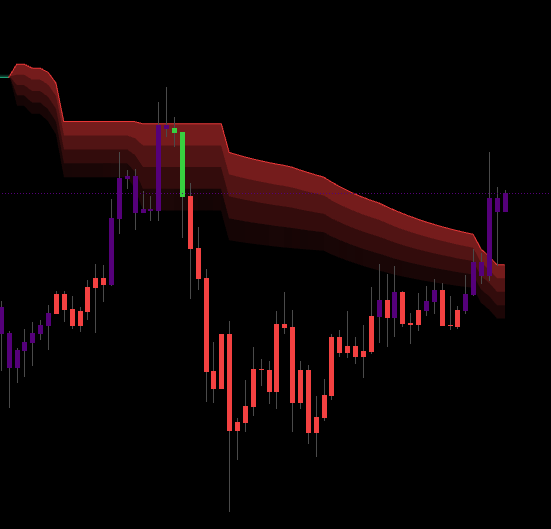
- Green — bullish macro trend (cloud sits below price).
- Red — bearish macro trend (cloud sits above price).
Reading RSI Band in 30 seconds
Four data points
| Question | How to read |
|---|---|
| What direction is the macro trend? | Cloud colour — green = up, red = down. |
| How strong is the trend? | Cloud width — wide = strong, narrow = weak / near flip. |
| Is price stretched or relaxed? | Close position relative to the near edge. |
| Where is the anchor? | The thin line on the far side of the cloud — the trend's lifeline. |
Five price zones (uptrend example)
 Five zones, five actions. Far above = wait; at near edge = entry; inside cloud = DCA; at anchor = last test; below anchor = exit.
| Close position | Meaning | Action |
|---|---|---|
| Far above the near edge (over-extension) | Strong momentum, possibly chasing | No new entry — wait for pullback. |
| Touches the near edge | Standard pullback | High-quality entry zone. |
| Price enters the cloud | Deep pullback, demand retest | DCA / scale in with tight stop beyond the anchor. |
| Touches the anchor | The trend's last test | Last-chance entry, or prepare to exit. |
| Breaks the anchor | Trend dying — wait for confirmation | Exit. No new entries. |
In a red downtrend cloud the geometry is mirrored.
Reading cloud width — the hidden trend strength gauge
The distance from the near edge to the anchor (cloud thickness) encodes trend strength, and few traders read it:
| Cloud width | Meaning | Mindset |
|---|---|---|
| Very wide, expanding over time | Strong trend with running room | Hold long, trail wide along the anchor. |
| Medium, stable | Healthy trend | Trade normally. |
| Narrow, contracting | Trend losing steam, possible flip | Take profit early, no adds. |
| Very narrow / squeeze | Big move incoming | Stay out, wait for the burst. |
A cloud that expands rapidly after a squeeze is a momentum burst — one of the strongest setups the study produces.
Self-adapting to timeframe
RSI Band automatically adjusts its speed to the chart timeframe. Whether you load 1m or 1D, you see the right kind of trend cloud for that timeframe with no manual tuning. On lower TFs the cloud reacts faster; on higher TFs it is more stable so it can hold monthly / quarterly trends.
RSI Band in the broader study
RSI Band is the highest-level macro filter — slowest, fewest flips, most stable. It does not give precise entries; it gives long-term bias so you do not trade against it.
The macro-filter rule
| RSI Band | Long | Short |
|---|---|---|
| Green (bull macro) | Allowed, full size | Forbidden — or scalp ≤ 25% size |
| Red (bear macro) | Forbidden — or scalp ≤ 25% size | Allowed, full size |
| Just flipped < 5 bars | Wait for confirmation | Wait for confirmation |
The cheapest rule to follow; the one that saves the most money.
Three-cloud confluence — the A+ tier
| Trend Cloud | Trail Cloud | RSI Band | Signal class |
|---|---|---|---|
| Green | Green | Green | A+ long — short / mid / long all in phase |
| Red | Red | Red | A+ short |
| Green | Green | Red | B short-term long — counter-macro, scalp |
| Red | Red | Green | B short-term short — pullback in bull macro |
| Conflicting mess | any | any | Skip — market chop |
The pragmatic 80/20: most of the year's biggest trades come from A+ setups (all three clouds same colour). If you only trade those, you lose less and your R:R is usually better because you can size up.
Combining with each signal module
| Signal module | RSI Band's role |
|---|---|
| Waves Trend | Macro filter — take ▲ only when RSI Band is green; ▼ only when red. |
| Contrarian | Special case — Contrarian is reversal logic. Can be taken against RSI Band when price is over-extended far past the near edge. |
| Advanced | RSI Band agreeing → full size; opposing → 25% size or skip. |
Recommended setup
- Enable RSI Band as the primary macro filter.
- Enable Trail Cloud for medium-term confirmation.
- Enable Trend Cloud for fast bias (skip on crowded charts).
- Pick a signal source — Waves / Contrarian / Advanced — and always filter it through RSI Band.
RSI Band takes meaningful chart real estate. If your chart is busy, disable Trend Cloud first — RSI Band + Trail Cloud + candles alone is a complete system. Never disable RSI Band.
Four-box pre-trade checklist
- RSI Band matches the trade direction. Hard rule — no exceptions.
- Cloud has held its colour for at least 5 bars (no fresh flip).
- Cloud is expanding or holding width (not contracting).
- Price is at / near the near edge or has just pulled back.
4/4 → A-grade, full size. 3/4 → B-grade, half size. 2 or fewer → skip.
Trading playbook
Long — entry inside a green RSI Band
| Step | Action |
|---|---|
| Wait | Green cloud dense, holding ≥ 5 bars, width stable / expanding. |
| Main entry | Price pulls back to the near edge + a bullish trigger candle. |
| Aggressive entry | Limit at the near edge; stop beyond the anchor. |
| Stop | A few ticks below the anchor (far edge). Anchor break = macro flip. |
| TP 1 (1/3) | When the cloud starts to contract (trend losing power). |
| TP 2 (1/3) | Previous swing high or major resistance outside the cloud. |
| TP 3 (1/3) | Trail using the near edge — exit when price closes below it for three consecutive bars. |
Short — entry inside a red RSI Band
Symmetrical: dense red cloud ≥ 5 bars, pullback into near edge + bearish trigger, stop above the anchor, trail near edge down, exit on three closes above.
Position sizing by cloud state
| RSI Band state | Suggested size |
|---|---|
| Wide, still expanding, smooth anchor | 100% |
| Wide but no further expansion | 75% |
| Medium width, normal | 50% |
| Contracting, bumpy anchor | 25% or skip |
| Just flipped < 5 bars | 0% — wait |
Tips to improve outcomes
Anchor Bounce — the most precise entry
In strong trends, price tends to do exactly one or two deep tests near the anchor during the entire trend cycle. These are the highest-R:R entries:
- RSI Band green, stable, running.
- Deep pullback through the near edge, into the middle of the cloud.
- Immediate bounce with bullish rejection candle.
- Volume spike accompanies.
Enter with stop just below the anchor; trail the anchor until flip. R:R is typically very favourable.
Squeeze + Burst — catching trend birth
A very narrow cloud (squeeze) signals an incoming move. When cloud width contracts to almost a single thin band, wait — when the cloud suddenly expands one direction (possibly flipping colour), enter in the burst direction with stop beyond the new anchor. Early entry on a freshly born trend captures the entire first leg.
Width Divergence — early-exit warning
The opposite signal:
- Price keeps printing higher highs (or lower lows).
- But cloud width contracts.
- → Trend is losing power, flip incoming despite "looking fine".
Take 50% off, raise stop to the near edge, do not chase distant targets.
Multi-TF stack
Run RSI Band on three timeframes (trading 15m → also open 1H and 4H):
| 15m | 1H | 4H | Trade type |
|---|---|---|---|
| Green | Green | Green | A++ long — full size, hold long. |
| Green | Green | Red | A long, moderate size, shorter targets. |
| Green | Red | Red | B / scalp only — short pullback in bear macro. |
| All conflicting | — | — | Skip; market chop. |
Read the near-edge gradient
The area near price has a gradient colour tied to momentum:
- Denser → price is far from the near edge, momentum strong → keep position.
- Lighter → price near the near edge, possible pullback → caution.
When the gradient noticeably fades after a dense phase, a pullback is likely imminent.
Live with the confirmation mechanism
RSI Band has a built-in noise filter — the cloud can lag a few bars behind the raw signal:
- Do not panic when the first bar breaks the anchor — wait for confirmation.
- When the cloud actually flips, a real macro flip has occurred.
- Do not try to predict the flip earlier than the cloud — the cloud is engineered to filter precisely.
Common mistakes
- Trading against RSI Band colour. The most dangerous mistake. Wrong macro filter = long-term bleed.
- Ignoring cloud width. A contracting cloud means the trend is weakening — adding longs in a squeezing green cloud eats the flip.
- Stops behind the near edge instead of the anchor. The near edge gets swept frequently (by design). Stops belong beyond the anchor.
- Manually changing settings per timeframe. RSI Band auto-adapts; do not override. If something feels off, suspect liquidity, not the indicator.
- Trading immediately after a flip. The noise filter helps, but the very first flip-layer can still get swept. Wait at least 5 bars.
- Using RSI Band alone for precise entries. RSI Band only gives bias. Add Trail Cloud or Trend Cloud + signal triangles to pinpoint entries.
- Disabling RSI Band for a clean chart. You just removed your most important macro filter. If the chart feels busy, disable Trend Cloud first; never RSI Band.
Common questions
Q. How does this relate to the traditional RSI oscillator? Very loosely — only momentum is used to colour the near-edge gradient. The rest has nothing to do with the traditional 0 – 100 oscillator.
Q. Why is it called "RSI Band" then? Historical reason — the original version was a real RSI band. The current version was redesigned completely, but the name was kept for alert and workflow compatibility.
Q. Does it work on 1m charts? Yes — the cloud self-adapts for 1m. But 1m is still noisy; the 5m – 4H range is the sweet spot.
Q. My cloud is not drawing.
Check that RSI Band is enabled in the indicator-overlay panel, and that the chart has enough history. A freshly loaded symbol may need a few dozen bars before drawing starts.
Q. Can the cloud stay one colour for a whole month? Yes — that is the strength. On 1D / 4H, RSI Band can hold a single colour for weeks to months on strongly trending assets. That is a feature, not a bug.
Q. When is RSI Band not useful? Long-term ranging markets — the cloud will flip every 5 – 10 bars. In those regimes, switch to mean-reversion strategies (Bollinger-style) instead of trend-following.
Where to go next
- Trend Cloud — the fast bias layer; the third cloud in the three-cloud confluence rule.
- Trail Cloud — medium-term layer that combines naturally with RSI Band macro reads.
- Waves Trend Signals — the entry engine you will filter through RSI Band.
- Advanced Signals — the higher-tier entry engine for swing / position with RSI Band as the macro gate.
- Overview — back to the study overview.