Order Blocks
The Volumetric Order Block engine inside mrD-Smart Ranges — auto-detects the institutional supply / demand zones that drove the last strong move, ranks them by relative order volume, and fires the primary BUY / SELL retest triangle when price returns. Full settings reference for Show Metrics, Show Last, Mitigation Type (Wick / Close / Average), High Timeframe confluence, and the Order Block Break / retest layer.
The Order Blocks module is the structural backbone of mrD-Smart Ranges. It auto-detects the last opposite-coloured candle before each impulsive move and treats the body / wick of that candle as an institutional supply or demand zone — a band of price where large desks absorbed orders before pushing the market. When price returns to one of those zones the model expects a reaction (bounce, sweep, or breakout retest), and the module fires the primary BUY / SELL triangle of the entire study.
This is the most important module to understand before any other layer. Imbalance / Liquidity / signals are all read through the OB map; getting the OB settings right is what makes the rest of the study coherent.
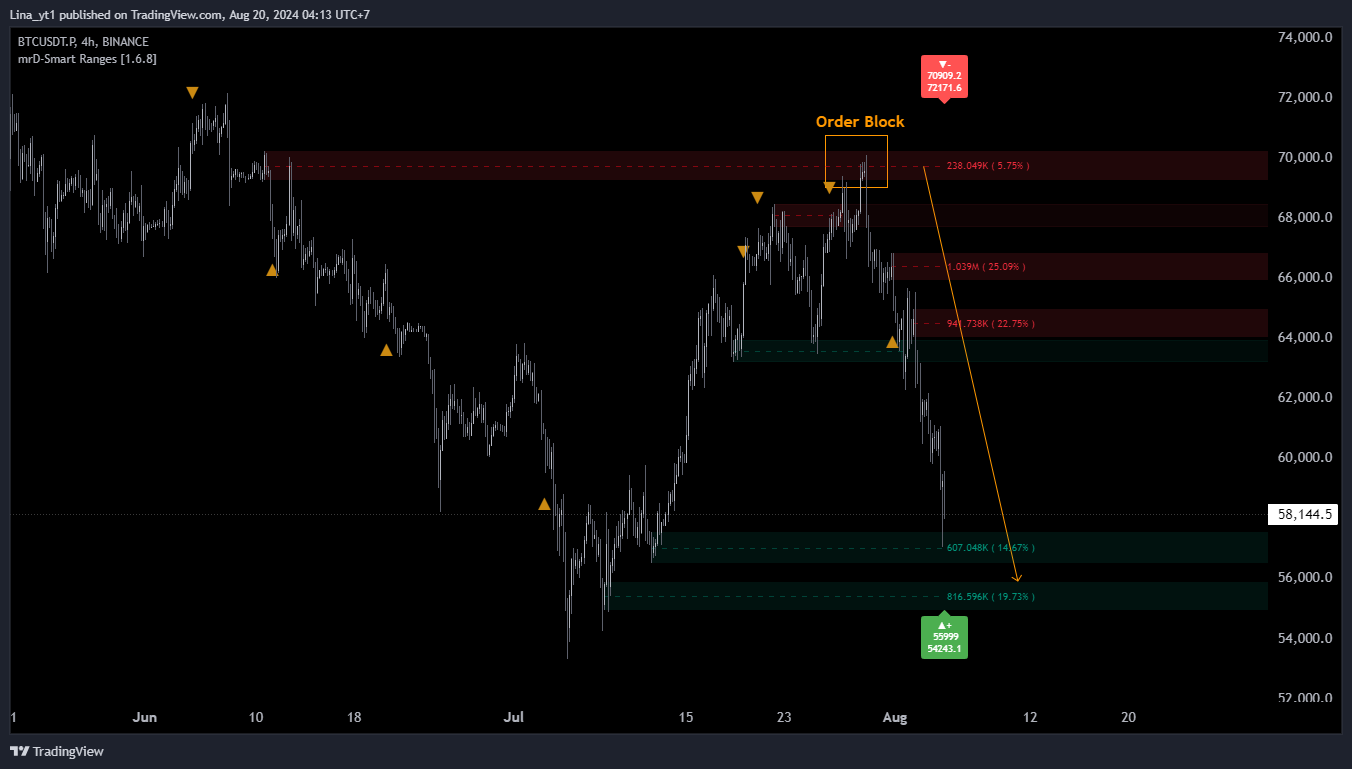 Cyan rectangles are demand OBs (price was rejected up); red rectangles are supply OBs (price was rejected down). The label
 22.4M (34%) means absolute order volume 22.4M and 34% of the cumulative volume of all visible OBs — a quick visual ranking.
What this module does
An Order Block in mrD-Smart Ranges is the last opposite-coloured candle (or cluster) immediately before a strong displacement candle. The classic example: a small green candle followed by three large red candles. The model marks the green candle's range as a bullish OB (demand) — institutional buyers had to absorb the supply at those prices before flipping the order flow.
The "Volumetric" prefix in the panel title (VOLUMETRIC ORDER BLOCKS) refers to how the engine ranks OBs:
- Each detected OB is tagged with the order volume traded inside its candle range.
- The engine computes the percentage weight of each OB against the cumulative volume of all currently-visible OBs.
- Higher % weight = more important zone. The strongest setups in this study are retests of high-% OBs that also align with an HTF OB and an FVG.
When price returns to an OB and the model's retest conditions are met, a BUY or SELL triangle prints. Those triangles are the OB Signal alert source — see Alerts.
Settings reference

| Setting | Default | What it controls |
|---|---|---|
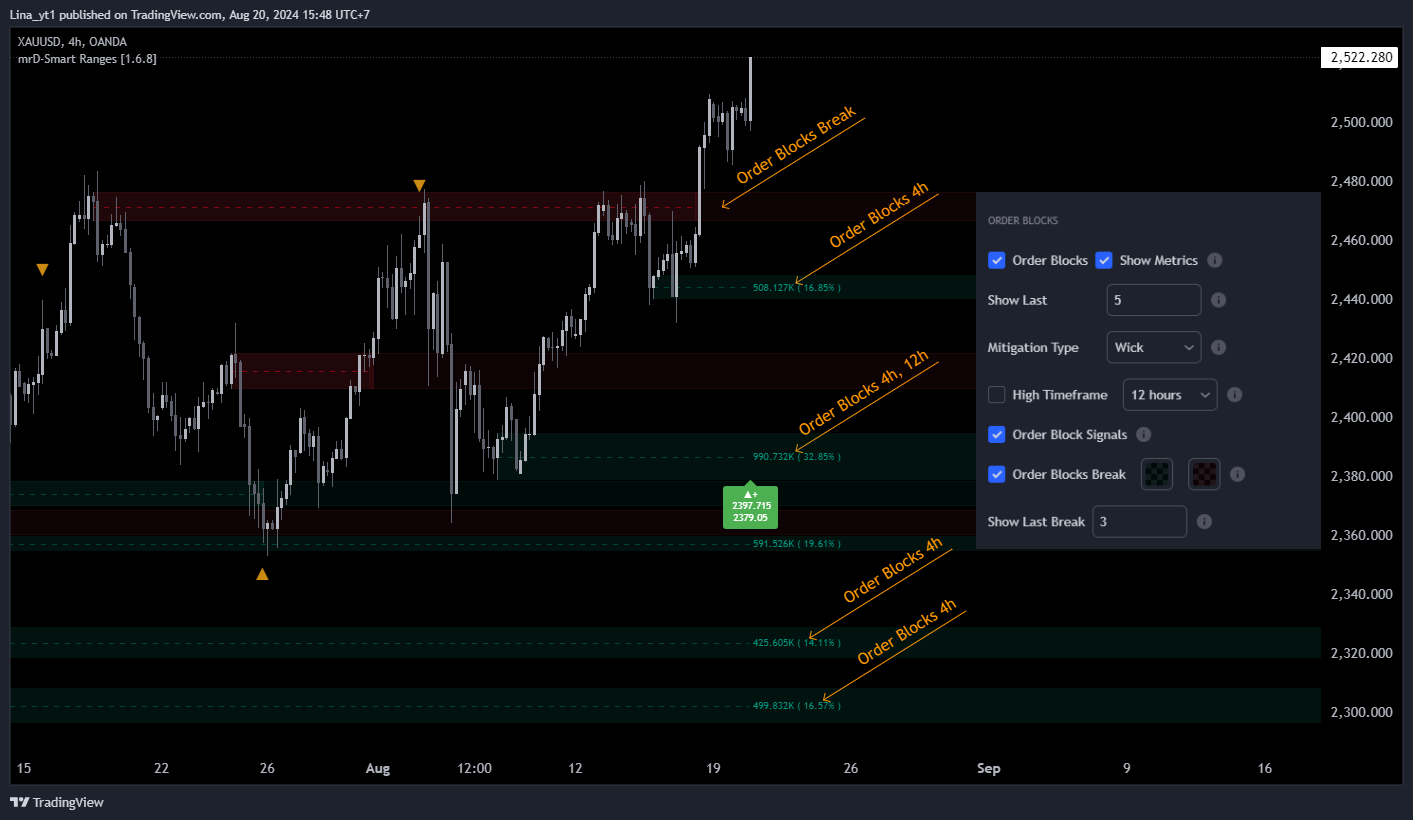
| Order Blocks | On | Master toggle for OB detection and rendering. Turn off if you want to use only the FVG / Liquidity layers. |
| Show Metrics | On | Renders the absolute volume and % weight label on each OB. Turn off if the chart feels crowded. |
| Show Last | 10 | Number of most-recent OBs to keep on chart. Older zones drop off as new ones appear. See Show Last tradeoffs below. |
| Mitigation Type | Wick | How the engine considers an OB "mitigated" (= consumed / invalidated). Three modes: Close / Wick / Average. See Mitigation Type below. |
| High Timeframe | Auto / one step up | Tells the engine to also pull OBs from a higher timeframe and highlight the ones that overlap with current-TF OBs. Confluence zones are the strongest. |
| Order Blocks Signals | On | Master toggle for the BUY / SELL retest triangle. Turn off if you only want the visual zones without the entry alerts. |
| Order Blocks Break | On | Render the "breaker" zones — OBs that were violated and are now acting as flipped support / resistance. |
| Show Last Break | 5 | Number of breaker zones to keep on chart. |
Show Last
Show Last is the most-tuned setting in this module. It caps how many OBs the engine keeps alive on screen, dropping the oldest first.
10— the default. Clean chart, easy to read, sufficient for swing / position timeframes (1H+).20–30— useful on 5m–15m where OBs appear faster. Increases the chance the relevant zone is still on the chart when price returns.40+— only justifiable on very low TFs (1m–3m) or while studying historical structure. The chart becomes hard to read in live trading.
If you find yourself zooming out and seeing a wall of overlapping rectangles, that is the signal to lower this number. The engine sorts by recency, so the oldest (and often least relevant) zones drop off cleanly.
Mitigation Type
This is the single most important tuning decision in the module. It defines when an OB is consumed and removed from the chart.
| Mode | Rule | Effect |
|---|---|---|
| Close | OB is mitigated when a candle closes beyond it. | Most aggressive — zones get removed faster. Use when you want a clean chart that only shows currently-fresh zones. |
| Wick (recommended) | OB is mitigated only when a candle's wick fully penetrates beyond it. | Conservative — zones stay live until they are truly violated. The default for this study and the value all the screenshots in this docs site use. |
| Average | OB is mitigated based on the average of its high / low range — somewhere between the two above. | Middle ground. Useful for traders who find Wick too lenient and Close too strict. |
The right pick depends on how you trade retests:
- If you want to keep a zone live until price fully breaks through, pick
Wick. You will see some "stale" zones that have already been briefly wicked but the model preserves them as still-relevant. - If you want zones to disappear the moment price closes through them, pick
Close. You will see fewer false retests but you will also lose some zones that would have produced a second valid reaction.
Pick one and stay consistent. Flipping between modes mid-session changes your read of what is "active" structure and ruins the playbook.
High Timeframe — the confluence highlight
High Timeframe is the multi-timeframe confluence layer. When enabled, the engine:
- Computes OBs at the chart timeframe (e.g. M15).
- Also computes OBs at the chosen higher timeframe (e.g. H1).
- Highlights the chart-TF OBs that overlap with an HTF OB — those are the strongest zones.
The recommended pairing is one step up from chart TF:
| Chart TF | Recommended HTF |
|---|---|
| 5m | 15m or 30m |
| 15m | 1H |
| 1H | 4H |
| 4H | 1D |
| 1D | 1W |
Jumping more than one step (e.g. 5m chart with D1 HTF) tends to produce too few overlaps to be useful — the H1 OB will almost always be larger than any M5 OB, so "overlap" becomes trivial.
Order Blocks Break — the retest engine
Order Blocks Break is the layer that turns broken OBs into the next generation of zones. When price violates an OB:
- The original OB is removed (per the Mitigation Type rule).
- The break level is preserved as a breaker zone — flipped support if it was a supply OB now being held above, flipped resistance if it was a demand OB now being held below.
- When price retests the breaker, the BUY / SELL triangle can fire — this is the OB Signal the alert system listens to.
Show Last Break caps the count of these breaker zones. The default of 5 is usually enough; bump to 10 on lower timeframes where breakers accumulate faster.
 The yellow-bordered rectangle is an OB Breaker (an OB that was previously violated and is now acting as flipped S/R). The
 BUY triangle prints when price retests it and the model agrees on bar close.
Trading playbook
The canonical Order-Block trade is built in three steps:
- Identify the zone in advance. Look at the chart with
Order BlocksON,High TimeframeON,Show MetricsON. Mark mentally any OB with%weight above 20 and an HTF overlap — those are the candidates. - Wait for price to come to the zone. Do not chase. The trade is the retest, not the breakout.
- Confirm with one more layer. The strongest entries are:
- OB retest + matched-direction FVG inside the same zone — see Imbalance Concept.
- OB retest + liquidity sweep just inside the zone (the BSL / SSL line is touched, briefly violated, then recovered) — see Liquidity Concept.
- OB retest + a same-direction Waves Trend triangle from mrD-Signals Premium.
A solo OB retest is a valid trade but with lower conviction than a confluence retest. In trending markets it works fine; in chop it produces false starts.
Tips for cleaner reads
- Always run
Show MetricsON in setup, then turn it off if the chart feels noisy. You only need the metrics to rank which zones are worth watching — once you have done the visual ranking, the numbers can be hidden. - Set Mitigation Type before you build any reads — switching mid-session changes what is active.
- HTF on swing setups, HTF off on scalp setups. On a 1m–3m scalp chart the HTF zones are too large to be entries; on a 15m+ swing they are the highest-conviction setups.
- Use the breaker zones as continuation targets. When a fresh OB breaks and becomes a breaker, the retest of that breaker is often the cleanest entry of the move — better than chasing the original break.
Common mistakes
- Trading every OB. The engine prints many OBs; only a handful are tradable per session. Use
%weight and HTF overlap to filter ruthlessly. - Using
Closemitigation in a high-volatility instrument. A single news candle will close through several OBs and wipe them off the chart.Wickis safer in volatile names. - Adding HTFs more than one step up. Less is more for confluence — H4 on a 15m chart is the canonical pairing.
- Forgetting
Order Block Signalsis a separate toggle. Turning offOrder Blocksalso disables the signals (no zones, no signals). But turning off onlyOrder Blocks Signalsleaves the visual zones intact — useful when you want to draw your own entries. - Mixing
Show Last = 50withShow Metrics ON. 50 labels on a 15m chart is unreadable. If you need more zones, hide the metrics.
Common questions
Why are some OBs much smaller than others? OB size = the candle range. A small consolidation candle produces a small OB; a wide-range candle produces a wide OB. Bigger is not always better — what matters is the % weight and the HTF overlap.
Why does an OB disappear before price retests it? Either (a) price already wicked through it under the current Mitigation Type, or (b) it dropped off because Show Last reached its cap and an older zone was discarded. Bump Show Last if you keep losing zones you wanted to watch.
Does the OB Signal repaint? No. Triangles confirm on bar close. The OB itself was confirmed on the close of the displacement move that created it, so the zone is also non-repainting.
Can I trade only OBs and ignore FVGs and liquidity? Yes — many traders do. The retest-triangle setups are tradable on their own. The other two layers are confluence tools that let you skip the weaker setups and only take the strong ones.
Where to go next
- The complementary FVG layer that often aligns with OBs: Imbalance Concept.
- The liquidity layer that explains the sweep just before an OB reaction: Liquidity Concept.
- Wire the BUY / SELL triangle into push / webhook delivery: Alerts.
- Pair with a momentum study for an extra confirmation gate: mrD-Signals Premium — Overview.
- Back to the study overview: mrD-Smart Ranges.