Overview
mrD-RSI Pullback is a specialist TradingView study for catching high-quality pullback entries after a momentum buildup phase — built around a 3D RSI Band trend cloud, multi-timeframe Advanced Pullback confluence, Hidden Divergence dots, and volume-based S/R zones. Trader-first documentation covering all eight modules, the 5-step workflow, and the 12 golden winrate rules.
mrD-RSI Pullback is the specialist pullback-entry study in the mrD-Indicators stack. While generic RSI tools fire signals the moment RSI enters overbought / oversold — which is where most traders enter wrong — this study waits for the market to prove its momentum, then pull back to value, then confirm continuation before issuing an entry. The result: fewer signals, tighter stops, and a naturally better risk-to-reward profile.
This is the overview for the study. Each of the eight feature modules has its own dedicated page linked from the list below. To install the study see Link your account & add the studies; for chrome and palette retune that should happen before any indicator is added, see TradingView Workspace Setup.
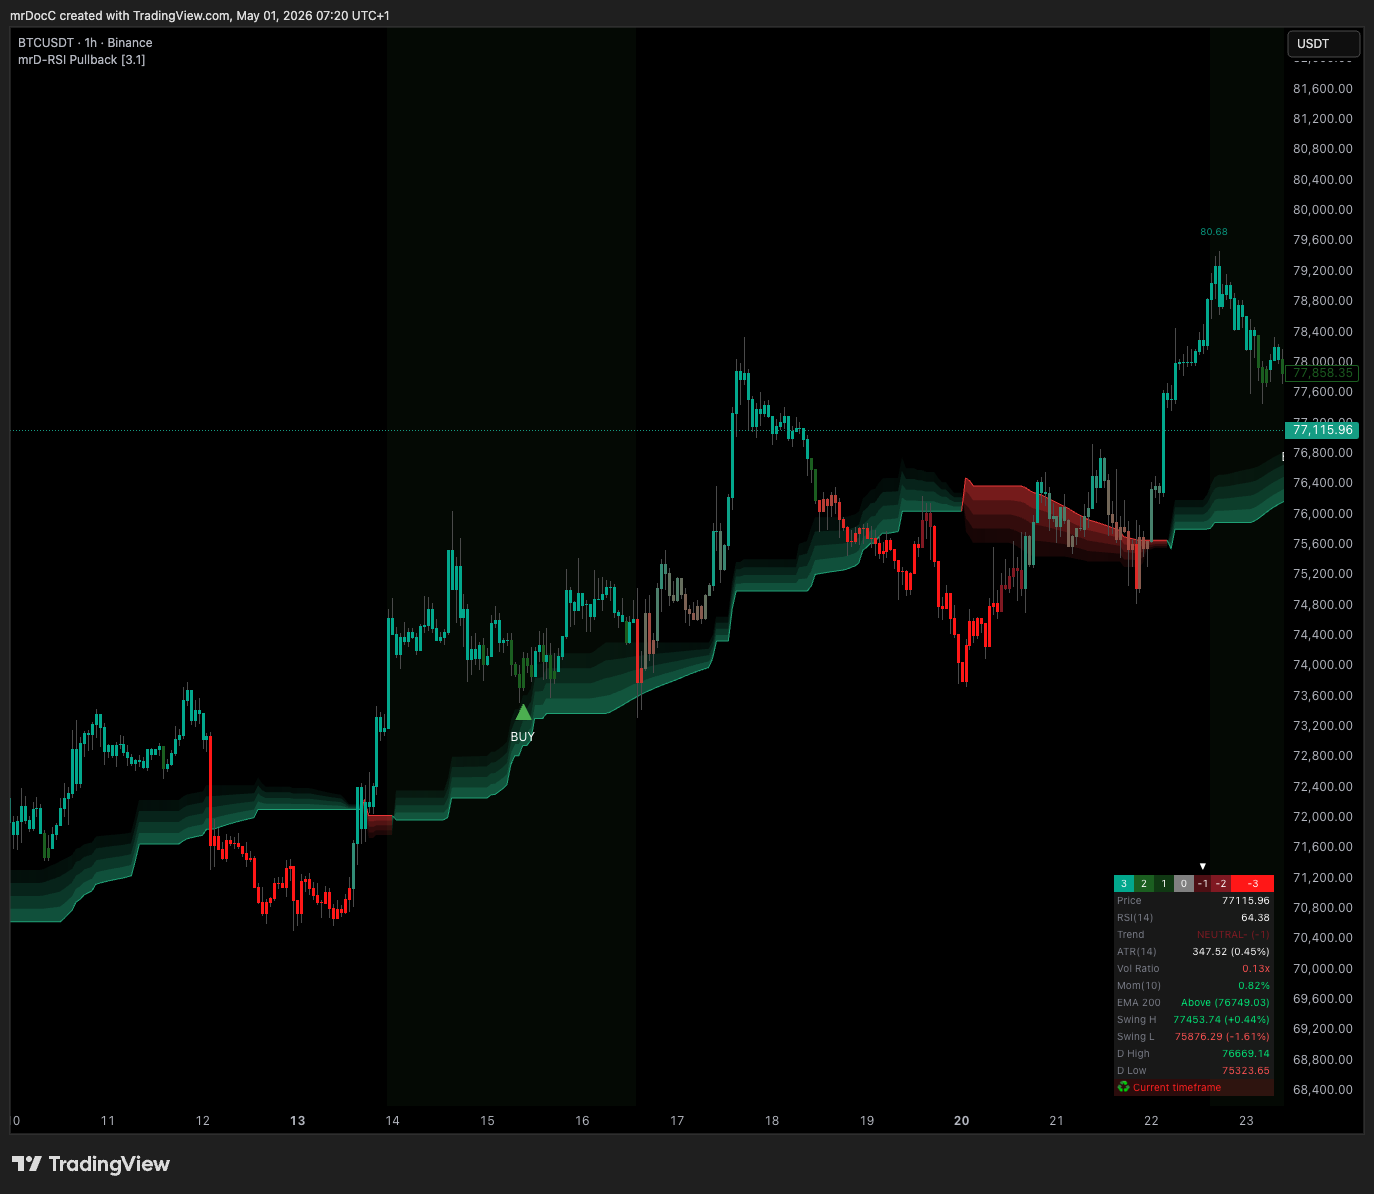 The complete study on one chart. Triangle markers are the Pullback BUY / SELL entries; the cloud underneath is the RSI Band regime filter; the green / red rectangles are S/R Volume Zones; the table on the right is the Info Table dashboard with trend status, RSI, ATR, volume ratio, EMA-200, and swing levels.
Who this study is for
mrD-RSI Pullback is built for traders who want value-area entries instead of chasing tops or knife-catching bottoms. Four trader profiles benefit from it:
- Pullback and swing traders — looking for entries at retracement points rather than at breakouts. The core philosophy of the study.
- Multi-timeframe traders — looking for confluence between the lower TF (timing) and higher TF (bias) before pulling the trigger. The Advanced Pullback mode (covered below) is built for this.
- Day-traders and scalpers — looking for precise entries on 5m–15m after RSI builds strong momentum and pulls back. The candle coloring layer makes the bias readable in one glance.
- DCA traders — looking for fair-value zones to add to existing trend-aligned positions. The S/R Volume Zones layer plus Hidden Divergence dots give the fair-value confirmation.
Not for:
- Traders who want a fully automated bot — the study is decision support, not auto-trade. Alerts can be wired to webhooks but you still design the strategy.
- Traders expecting a 100% win rate — no indicator delivers that.
The study works on every market: crypto, forex, indices, equities, commodities. Higher-liquidity instruments and the 1H–4H timeframe band produce the best signal quality.
Core philosophy
Don't chase tops — wait for the pullback. Don't catch knives — wait for the confirmation.
The study refuses to fire signals at the moment RSI enters overbought / oversold. Most traders enter exactly there and get stop-hunted. Instead, the study waits through the impulse phase, lets price come back to value, and only then — when continuation confirmation appears — does it issue the entry signal. The trade-off is deliberate:
- Reduces stop-hunt frequency.
- Improves risk-reward by entering close to support / resistance rather than at the extreme.
- Filters out most signals during sideways action.
A trade not taken is no loss. A wrong trade taken is a real loss. The study prioritises eliminating wrong trades over capturing every move.
Feature overview
The study is built from eight independent modules that share one chart. You enable the ones that match your style and leave the rest off; the modules stay decoupled so a Pullback Signal does not depend on Candle Coloring being visible.
| Module | Purpose | Recommended state |
|---|---|---|
| Pullback Signals | Entry triangle after a confirmed pullback from OB / OS | Always on — core |
| Advanced Pullback | Multi-timeframe confluence on the entry — fewer signals, higher winrate | Swing / position trading |
| RSI Band | The 3D trend cloud — directional filter for every signal | Always on — mandatory filter (covered in Pullback Signals) |
| Candle Coloring | Bar tinting by RSI state — read momentum at a glance | Day-trading / scalping |
| Hidden Divergence | Dots that flag trend-continuation points | Advanced technical traders |
| S/R Volume Zones | Auto-drawn supply / demand zones from volume-spike pivots | When you need precise TP / SL levels |
| Info Table | 12-row trading dashboard in the chart corner | Always on — context snapshot |
| Alerts | TradingView alert wiring for push / email / webhook | Swing / off-screen trading |
The study has its own internal grading: 2 confluence factors = B, 4 = A, 5+ = A++. The grade matters because the rules for sizing differ — see Winrate Tips for the full setup-classification table.
Recommended workflow — 5 steps, applied every trade
This is the standard workflow the entire study is built around. Skip a step and the win rate suffers.
- Open your main trading-TF chart (e.g. 1H for swing, 15m for day-trade).
- Read the RSI Band cloud — green = LONG bias, red = SHORT bias, choppy / flipping = stand aside.
- Enable Pullback Signals in
Bothmode so you see both directions; pickBUYonly orSELLonly later if your strategy mandates it. - Read the Info Table — confirm RSI, Vol Ratio, EMA-200, ATR all align with the signal direction.
- Take the trade when a signal fires + place SL just outside the nearest S/R Volume Zone; TP at the next opposing zone or at a fixed R:R 1:2 / 1:3.
The full step-by-step is in Getting Started and the 30-second pre-entry checklist in Winrate Tips.
Chart symbol legend
A quick reference for every visual element the study can render on the chart.
| Symbol | Meaning |
|---|---|
| ▲ BUY (deep green) | Standard Pullback Buy — long entry |
| ▼ SELL (deep red) | Standard Pullback Sell — short entry |
| ▲ BUY (light green) | Advanced Pullback Buy — multi-TF confluence confirmed |
| ▼ SELL (light red) | Advanced Pullback Sell — multi-TF confluence confirmed |
| Green cloud area (RSI Band) | Uptrend regime — favour longs |
| Red cloud area (RSI Band) | Downtrend regime — favour shorts |
| Small green dot | Hidden Divergence — bullish continuation |
| Small red dot | Hidden Divergence — bearish continuation |
| Green box with "S" | Volume-based support zone (★ = fresh, untested) |
| Red box with "R" | Volume-based resistance zone (★ = fresh, untested) |
| Faint green / red background | RSI oversold / overbought warning |
Advanced Pullback
Advanced Pullback is Pullback Signals upgraded with multi-timeframe confluence. Where standard Pullback only analyses the chart's TF RSI, Advanced Pullback requires the higher TF RSI to be in a matching state before any signal fires. The result: roughly 50–70% fewer signals, but a 15–25% higher win rate.
The rest of this section is the complete reference for the Advanced Pullback mode. For the core engine that Advanced extends, read Pullback Signals first.
 The lighter-coloured triangles are Advanced fires. They appear less often than the deep-coloured standard Pullback triangles, but every one carries higher-TF confluence already.
What is Advanced Pullback?
While the standard Pullback Signal only analyses the chart's TF RSI, Advanced Pullback requires two conditions to align:
- The chart TF (Base TF) is showing a valid pullback.
- The higher TF (Higher TF) has RSI in a state matching the signal direction.
Only when both timeframes align does the signal fire. This filters out the most common loss case in standard Pullback: a 15m or 1H setup that fires against the dominant 1H / 4H trend.
Why use Advanced Pullback?
Problem with single-TF signals. Standard Pullback can fire in scenarios like:
- 15m looks great, but 1H is trending opposite → entering = blowup.
- 5m fires a signal but 15m is sideways → poor R:R.
The Advanced solution. By requiring the higher TF to align, the indicator removes most "against-larger-trend" signals → significant winrate boost.
Trade-off: fewer signals (50–70% of standard), but higher win rate (+15–25%) and better average R:R.
Enabling Advanced Pullback
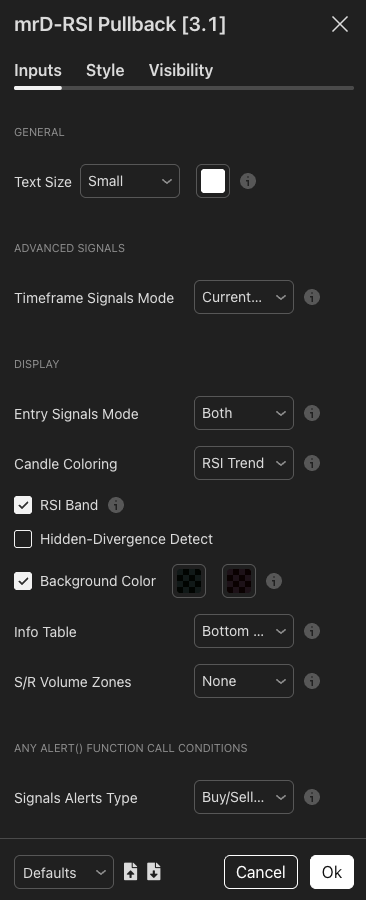
Step 1. Open Settings → group Advanced signals.
Step 2. Choose Timeframe Signals Mode. Pick the TF pair that matches your style:
| Option | Trade TF | Confluence TF | For |
|---|---|---|---|
| 5m & 15m | 5m | 15m | Scalper |
| 15m & 1h | 15m | 1h | Day-trader |
| 1h & 4h | 1h | 4h | Day-trader / Swing |
| 4h & 8h | 4h | 8h | Swing trader |
| 4h & D | 4h | Daily | Swing trader (recommended) |
| 8h & 12h | 8h | 12h | Swing trader (crypto) |
| D & 3D | Daily | 3D | Position trader |
| D & W | Daily | Weekly | Position / DCA |
| 3D & W | 3D | Weekly | Long-term DCA |
Important. The Trade TF is the TF you have your chart open on. If you pick
1h & 4h, you must be on the 1H chart for signals to fire.
Step 3. Chart must be on the correct Trade TF. If your setting is 1h & 4h but you're viewing the 15m chart → the Info Table shows a warning row:
Go to 1h to Display Signals
Switch chart TF to 1H → signals will appear.
Reading Advanced signals on chart
▲ BUY (light green) — below the bar. Different from standard BUY: lighter green. The indicator displays the same "BUY" label but with a softer colour to mark it as Advanced. Meaning: both Trade TF AND Confluence TF agree on LONG → enter with greater confidence.
▼ SELL (light red) — above the bar. Different from standard SELL: lighter red. Meaning: both timeframes confluence SHORT → enter short with high reliability.
Standard vs Advanced — comparison
| Metric | Standard Pullback | Advanced Pullback |
|---|---|---|
| Number of TFs analysed | 1 (chart TF) | 2 (chart TF + HTF) |
| Signals / month (approx) | ~30–60 | ~10–25 |
| Estimated win rate | 50–60% | 65–75% |
| Average R:R | 1:1.5 | 1:2.0+ |
| Best for | Fast day-trader | Quality swing trader |
| Need to watch chart? | Continuously | Can use alerts |
The numbers above are conservative estimates from typical liquid crypto / forex behaviour. Actual results vary by asset, market regime, and risk management discipline.
Eight tips for trading Advanced Pullback effectively
Tip 1 — Pick TF pairs with a "1:4 ratio". HTF that's 3–6× the Base TF gives the best confluence:
15m & 1h(4×) — recommended.1h & 4h(4×) — recommended.4h & D(6×) — recommended.4h & 8h(2×) — too close, weak confluence.D & W(7×) — bit too far, HTF rarely shifts.
Tip 2 — Set up dedicated alerts for Advanced. Since Advanced fires rarely, do not sit at the chart waiting. Set up an alert (see Alerts) with mode Buy/Sell Advanced Pullback.
Tip 3 — Prefer Advanced in volatile markets. When BTC is wild / macro news is hot → many fakeouts → Advanced filters better than standard.
Tip 4 — Combo Advanced + S/R Volume Zone = A++. An Advanced signal firing inside / near a Support Zone (for BUY) or Resistance Zone (for SELL) = golden setup. You can size up 1.5× normal for these.
Tip 5 — Check Info Table before entering. The Info Table has a "Trend" row — should show STRONG BULL (3) or WEAK BULL (2) for BUY (and vice versa for SELL). If it shows NEUTRAL → be cautious.
Tip 6 — Combine with EMA 200. The Info Table has an "EMA 200: Above / Below" row. Advanced BUY when price is Above EMA200 → major trend also aligns → A++ setup.
Tip 7 — Trade by session. US session for crypto / forex / US stocks is when Advanced signal quality is highest.
Tip 8 — Do not force trades. A whole week without a single Advanced signal on your watchlist → do not lower your standard to standard Pullback just to trade. Switch to another asset that is trending.
The "Go to {TF} to Display Signals" warning
If the Info Table shows a red row:
Go to 1h to Display Signals
You are on the wrong chart TF for your Advanced Mode setting. Two fixes:
- Switch chart TF to the one your setting requires.
- Or change
Timeframe Signals ModetoCurrent timeframeto use standard signals.
The four-phase advanced workflow
The standard professional workflow for trading Advanced Pullback. Roughly 15 minutes of setup, then alerts do the work.
Phase 1 — Pre-market scan (5 min).
- Open 4H charts of your watchlist assets.
- Check the RSI Band cloud — find assets that are strongly trending (clearly green / red cloud).
- Filter down to 3–5 assets with the cleanest cloud.
Phase 2 — Set up alerts (10 min).
- On each selected asset, add the indicator.
- Settings:
1h & 4hmode (or4h & Dfor longer swing). - Set alert mode =
Buy/Sell Advanced Pullback.
Phase 3 — Trade when alerts fire.
- Receive alert → open that asset's chart on 1H (or your Trade TF).
- Apply the 30-second checklist from Getting Started.
- Enter + place SL / TP.
Phase 4 — Manage (periodically).
- Open TradingView mobile app, check every 1–2h.
- Reach TP1 → move SL to break-even.
- Opposite signal fires → exit.
Hypothetical performance comparison
The numbers below are illustrative. Actual results vary by asset, market, risk management. Do not treat them as guarantees.
| Strategy | Signals / mo | Win rate | Avg R:R | Profit factor |
|---|---|---|---|---|
| All standard Pullback | ~50 | 55% | 1.4 | 1.5 |
| Standard + tight cloud filter | ~30 | 62% | 1.6 | 1.9 |
| Advanced Pullback | ~15 | 70% | 2.0 | 2.5 |
| Advanced + S/R + Hidden Div confluence | ~5 | 80%+ | 2.5+ | 3.0+ |
The tighter the filter, the higher the profit factor — but you need patience.
Advanced Pullback — common questions
I selected 1h & 4h but standard Pullback signals still appear? Possibly a confusion. Standard Pullback (deep BUY / SELL) does NOT fire when an HTF mode is selected. Only Advanced (lighter labels) fires. Re-check settings.
Advanced fires too rarely — can I loosen the filter? Not directly. The indicator filters intentionally tight. Two loosening options exist:
- Switch to a closer TF pair (e.g.
15m & 1hinstead of15m & 4h). - Use a more volatile asset (BTC > Gold > Stocks).
Can I trade both standard Pullback and Advanced at once? Not within one indicator instance — you must choose one mode. However you can add 2 instances to the chart (one in Current timeframe, one in 1h & 4h) → see both signal types. Then:
- Full size when Advanced fires.
- 1/3 size when only standard Pullback fires.
Where to backtest Advanced Pullback? TradingView does not allow indicator backtesting (only strategies). You must paper-trade manually at least 30 trades, log win rate and actual R:R on your chosen asset.
Wait less, win more. Fewer signals = better signals = richer trader. Advanced Pullback is the mode every serious swing trader settles into after they tire of standard-mode noise. It changes the work pattern from "watch the chart" to "wait for the alert", and that change is what makes consistent results possible.
The full module index
| # | Page | What it covers |
|---|---|---|
| 1 | Getting Started | Install, recommended settings per trading style and asset class, the first 3 trade steps, the 30-second pre-entry checklist, beginner mistakes. |
| 2 | Pullback Signals | The core entry engine — what triggers a signal, built-in filters (RSI Band cloud filter, momentum confirmation, anti-double-fire), 10 winrate-boosting tips, when NOT to take a signal, trade management. |
| 3 | Advanced Pullback | The multi-timeframe upgrade — TF pair table, comparison with standard Pullback, the "Go to {TF}" warning, advanced trader workflow. (In this page — see the section above.) |
| 4 | Candle Coloring | RSI-state bar tinting, four strategies (consecutive same-colour bars, colour transitions, cloud combo, gradient zone), use cases per style. |
| 5 | Hidden Divergence | What Hidden Divergence is, how it differs from regular divergence, A++ setups, the dot-plus-Pullback combo. |
| 6 | S/R Volume Zones | Auto-drawn volume-based supply / demand zones, Fresh ★ priority, four use cases (BUY from support, SELL from resistance, breakout, SL placement). |
| 7 | Info Table | The 12-row dashboard — Trend Status arrow, RSI, ATR, Vol Ratio, Mom, EMA-200, swing levels, daily high / low, the 5-second pre-trade workflow. |
| 8 | Winrate Tips | The 5-step workflow, 12 golden rules, A / B / C setup grading, money management (1% rule / 6% week / 10% month), trading psychology, common errors. |
| 9 | Alerts | The 6 alert modes, message format reference, Trend Bands alertcondition, webhook integration for auto-trade bots. |
Important warnings
A trading study is decision support, not an order. Every signal can fail. The points below catch every new user once.
- No signal is correct 100% of the time. Win rate scales with how strictly you filter — the same Pullback Signal taken with cloud alignment + Hidden Divergence + S/R Zone confluence has a much higher hit rate than the same signal taken in isolation.
- Higher timeframes → fewer but more reliable signals. A 4H Advanced Pullback is far more valuable than a 5m standard Pullback.
- Lower timeframes → more signals but more noise. Win rate drops at 1m–5m because the noise floor is structurally higher.
- Never use heavy leverage on a single "pretty" signal. Even an A++ setup fails some fraction of the time.
- Combine with structural reads from mrD-Smart Ranges. RSI Pullback tells you when momentum is right; Smart Ranges tells you where the structural reactions happen. The two paired produce the cleanest trade ideas in the suite.
Where to go next
- The install / settings-per-style walkthrough: Getting Started.
- The core entry engine: Pullback Signals.
- The 12 golden rules every trader should re-read weekly: Winrate Tips.
- Pair with the structural map: mrD-Smart Ranges.
- Pair with the composite signal engine: mrD-Signals Premium.