Candle Coloring
Candle Coloring (RSI Trend) inside mrD-RSI Pullback — every bar self-colors by current RSI state so you read momentum without looking at the RSI panel. Full reference for the five state colors (bright green / dark green / bright red / dark red / gradient), the four trading strategies (consecutive same-color bars, color transitions, cloud combo, gradient zone), seven trading tips, and three real-world use cases.
Candle Coloring is the momentum-readability layer of mrD-RSI Pullback. When enabled, every bar on the chart tints itself according to the current RSI state — bright green for Strong Bull, dark green for Weak Bull, gradient for the neutral zone, dark red for Weak Bear, bright red for Strong Bear. The result: you read momentum at a glance without flipping to the RSI panel.
This page is the complete reference for the Candle Coloring module. Bar colour is context, not a trigger — the actual entry trigger remains the Pullback Signal triangle. Use this layer to fast-filter which signals to even consider.
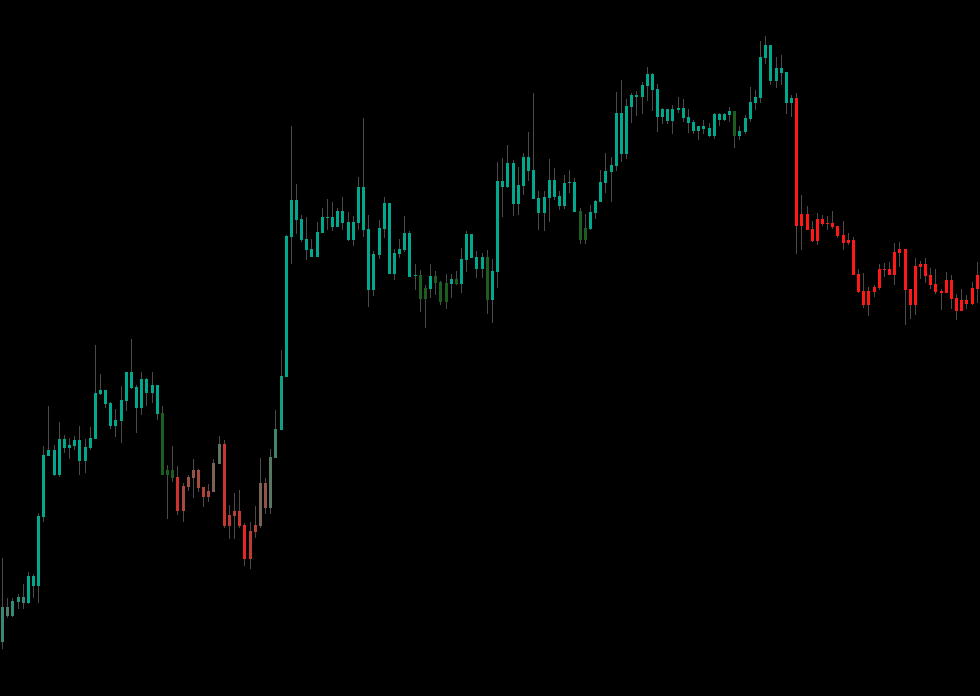 The bar palette mirrors the RSI state directly. Five bright same-colour bars in a row = trend in golden phase; gradient bars = indecision zone, wait for full-colour bars to return before acting.
1. What is Candle Coloring?
When enabled, every bar on the chart is coloured by current RSI state instead of the standard green / red. Four main colours plus a gradient:
- Bright green — Strong Bullish.
- Dark green — Weak Bullish.
- Bright red — Strong Bearish.
- Dark red — Weak Bearish.
- Gradient — when RSI is neutral (33–67), bars smoothly shift colour by RSI value.
Looking at the colour, you instantly know which side momentum is on without checking the RSI panel.
2. Enable / disable Candle Coloring
Open Settings → group Display → Candle Coloring
| Option | Effect |
|---|---|
| None | Keep original bar colours (standard green / red) |
| RSI Trend | Enable RSI palette — default, recommended |
3. State classification
| Bar colour | State | Meaning | Action |
|---|---|---|---|
| Bright green | Strong Bull | RSI broke high zone + above 50 | Strong uptrend — confidently LONG |
| Dark green | Weak Bull | Uptrend but RSI < 50 | Weak trend — wait for confirmation before LONG |
| Bright red | Strong Bear | RSI dropped deep + below 50 | Strong downtrend — confidently SHORT |
| Dark red | Weak Bear | Downtrend but RSI > 50 | Weak trend — wait for confirmation before SHORT |
| Gradient | Neutral | RSI 33–67, no clear trend | Stand aside, or trade by signal only |
4. Four strategies to find effective signals
Strategy 1 — Count consecutive same-colour bars
Simple rule: when you see ≥ 5 bright same-colour bars in a row → trend is in golden phase.
- 5+ bright green bars → strong uptrend → every BUY signal is opportunity.
- 5+ bright red bars → strong downtrend → every SELL signal is opportunity.
Strategy 2 — Watch for colour transitions
When bars shift from bright to dark:
- Bright green → Dark green = uptrend weakening → take profit on longs.
- Bright red → Dark red = downtrend weakening → take profit on shorts.
This is an early warning before the RSI Band cloud flips.
Strategy 3 — Combo with the cloud
| Cloud | Bar colour | Action |
|---|---|---|
| Green | Bright green | A++ setup — full size on BUY signal |
| Green | Dark green | B setup — half size |
| Green | Red (bright or dark) | Warning — deep pullback, wait for confirmation |
| Red | Bright red | A++ setup — full size on SELL signal |
| Red | Dark red | B setup — half size |
| Red | Green (bright or dark) | Counter-bounce in downtrend, do not enter |
Strategy 4 — Gradient = decision zone
When bars become gradient (RSI 33–67 zone):
- This is the indecision zone.
- Wait for bars to fully shift to bright green or bright red before entering.
5. Seven trading tips with Candle Coloring
Tip 1 — Bar colour is NOT an entry signal
Do not enter just because you see a bright green bar. That is context, not a trigger. The trigger is still the Pullback Signal (▲ / ▼).
Tip 2 — Bar colour helps fast-filter signals
Before looking at the Pullback signal, glance at the last 5 bars:
- Mostly bright green → LONG bias → BUY signal = enter confidently.
- Mostly bright red → SHORT bias → SELL signal = enter confidently.
- Mixed → sideways → skip the signal.
Tip 3 — Count the streak to gauge trend life
- 3–7 same-colour bright streak = healthy trend, more room.
- 15+ same-colour bright bars = trend has run far, possibly near top / bottom → do not add to position.
Tip 4 — Bars switching colour right after a Pullback signal = confirmation
If a BUY signal fires, then the next 2 bars are both bright green → trade is going right → can trail SL more aggressively.
Tip 5 — Wrong-side colour cluster = exit
Holding long but seeing 3 consecutive red bars (bright or dark) → momentum reversed → close everything, do not hope-hold.
Tip 6 — Avoid gradient bars on low TF
1m–5m often has many gradient bars → market is noisy → use None for candle colour on these TFs to reduce distraction.
Tip 7 — Toggle by style
- Day-trader: on (need to read momentum fast).
- Swing trader: optional (sometimes off for chart cleanliness).
- Position trader: off (do not need fine momentum).
6. Three real-world use cases
Use case 1 — Day-scalping BTC 5m
- Open BTC 5m chart, enable Candle Coloring + RSI Band.
- Wait for green cloud + 5 consecutive bright green bars.
- Pullback (1–2 dark red or gradient bars) → wait for BUY signal.
- BUY signal fires inside cloud zone → enter, target 0.3% R:R 1:2.
- When 2 consecutive dark red bars appear → close everything.
Use case 2 — Reading context before swing trade
- Open EURUSD 4H chart.
- Quick glance at last 10 bars:
- Mostly dark / bright green → bullish context.
- Mostly dark / bright red → bearish context.
- Decide to only hunt BUY or only hunt SELL for the session.
- Avoid trading when 10 bars are mixed (sideways).
Use case 3 — Spot reversal early
- In a downtrend (red cloud + red bars).
- Suddenly 2–3 dark green bars appear → early warning for reversal.
- If a SELL signal is firing → close the SELL immediately, do not hold.
- Wait for cloud to flip green + first BUY signal = new long entry.
7. Common mistakes
| Mistake | Fix |
|---|---|
| Treating bar colour as entry signal | Bar colour = context only; signal = trigger. |
| Going long on the first bright green bar | Wait for ≥ 3 same-colour bars to confirm. |
| Holding long when bars turn consecutively red | Holding = losing money. Cut loss now. |
| Disabling candle colour to clean chart then ignoring context | Re-enable — context filters wrong direction. |
Common questions
Do bar colours repaint? No. Each bar colours when its data is confirmed. The live bar can change colour per tick (by current RSI) but locks at bar close.
Why do bars sometimes look greyish / dark? When RSI is in the neutral zone (33–67), bars use a smooth gradient from red to green → middle range has intermediate tones (grey, light brown). This is a feature, not a bug.
Can I customise the colours? Not via input — colours are fixed for synchronisation with the cloud.
How is candle colour different from a Pullback signal?
- Candle colour = state of current momentum (context).
- Pullback signal = specific entry moment (trigger).
The two complement each other.
Final thought
Five consecutive bright same-colour bars = healthy trend. Healthy trend = profitable trade.
Candle Coloring is a one-glance filter, not a strategy. Use it to decide which signals to even look at — then let the Pullback Signal triangle and the rest of the modules confirm the entry.
Where to go next
- The core entry engine: Pullback Signals.
- The Hidden Divergence dots that pair with bright-bar context for A++ setups: Hidden Divergence.
- The Info Table for full pre-entry context: Info Table.
- The 12 golden rules for max win rate: Winrate Tips.
- Back to the study overview: mrD-RSI Pullback.