Status bar & tooltips
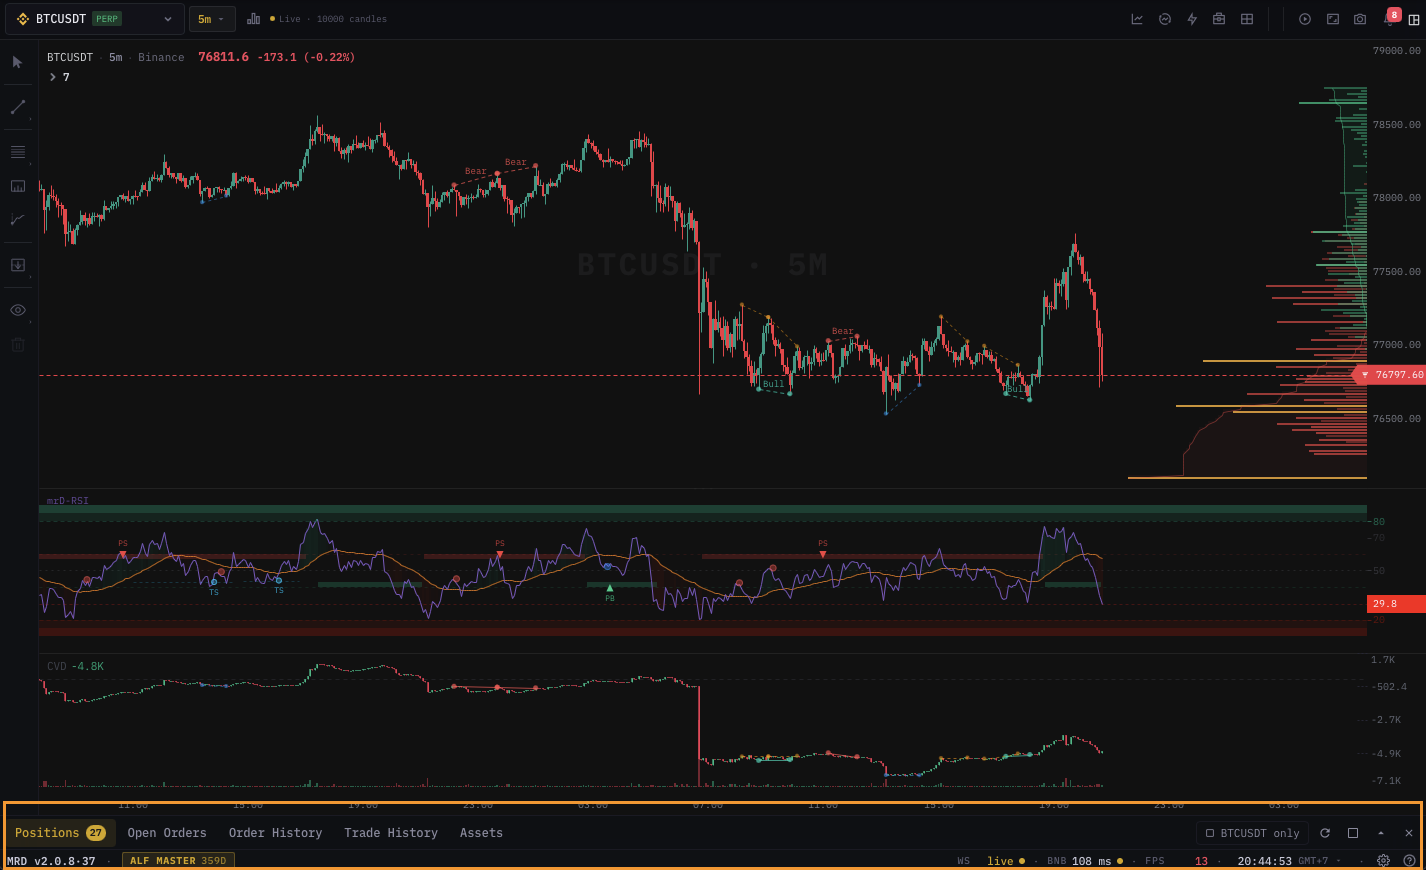
The strip at the bottom of the terminal — connection state, last-tick timestamp, account balance, P&L, sound toggle. Plus the hover-driven tooltips painted over the chart.
The status bar at the very bottom of the terminal is a one-line telemetry strip — connection state, latency, last-tick time, account balance, unrealized P&L, and the master sound toggle. Above the chart, hover-driven tooltips surface per-candle OHLC, per-indicator values, footprint cell breakdowns, and depth-profile hover. This page documents the bar's cells and the hover overlays.
The status bar
The bar runs across the bottom of the page below the bottom panel.
| Cell | Shows |
|---|---|
| Connection | Coloured dot + venue name. Green = WebSocket connected. Amber = reconnecting. Red = disconnected. Click for connection details. |
| Latency | Round-trip latency to the venue in ms. Updates every 5 s. |
| Last tick | Timestamp of the most recent trade on the active pane's symbol. Goes red after 10 s of silence on a market that should be live. |
| Account | Account label (Binance Main / Sub-1 / FX-IG / ...). Click to switch active account. |
| Balance | Current account equity in the account's quote currency. |
| Unrealized P&L | Sum of unrealized P&L across all open positions for the active account. Green if positive, red if negative. |
| Open positions | Count of open positions on the active account. |
| Working orders | Count of pending orders. |
| Bot status | A dot per active autotrade strategy — green = running, amber = paused, red = error. |
| Sound | Master sound toggle (mute / unmute) for all alerts and order events. |
| Theme | Dark / light toggle. |
The bar updates in real-time as ticks arrive, positions move, and orders fill.
Hover details
Hover any cell to see a detail tooltip:
- Connection → venue, region, last reconnect time, current rate-limit headroom.
- Latency → 1 s / 1 min / 5 min latency averages.
- Account → free / used / margin / leverage utilization.
- Bot status → list of strategies with their last action.
Clicking through
- Connection → opens the API connection page.
- Account → switches the active account.
- Open positions → focuses the bottom panel on the Positions tab.
- Working orders → focuses the bottom panel on the Orders tab.
- Bot status → opens
/trading/auto-trade.
Connection states
| State | Color | What it means |
|---|---|---|
| Connected | Green | WebSocket alive; receiving data. |
| Reconnecting | Amber | Lost the socket, retrying with backoff. The chart pauses until reconnect; on reconnect we fetch and stitch the missed candles silently. |
| Disconnected | Red | Backoff exhausted (e.g. network is down). The chart stops updating. Restoring the network auto-resumes; manual click on the cell triggers an immediate reconnect attempt. |
| Rate-limited | Orange dot | The venue throttled us. The terminal backs off and resumes when the limit lifts. |
| Auth error | Red ring | Your API key was rejected. Open /trading/api-connect to re-authorize. |
P&L colors
- Unrealized P&L uses the live last-trade price for each open position. Updates every tick.
- Color is green for positive, red for negative, white for zero / no positions.
- Currency matches the account's quote — USDT for Binance USDⓈ-M, USD for FX.
If you have positions across multiple symbols, the cell sums them all. To see per-symbol P&L, hover the cell or open the Positions tab in the bottom panel.
Hover tooltips on the chart
Crosshair OHLC tooltip
Default top-left overlay on every pane when you hover the chart. Shows for the hovered candle:
- Date / time (in your selected timezone).
- Open / high / low / close.
- Change % (close vs. open).
- Volume.
Toggle visibility in Chart settings → Tooltips → OHLC tooltip. Position is configurable (top-left / top-right / bottom-left).
Indicator value tooltip
Below the OHLC tooltip, each active indicator paints a one-line value for the hovered bar. Examples:
RSI(14) = 64.2 (BUY zone)EMA(50) = 65,420.50mrD-RSI Pullback: bull pullback firing on 4H
Toggle per-indicator visibility in each indicator's settings dialog → Display → Show in hover tooltip.
Footprint cell tooltip
When Footprint chart type is active, hovering a cell paints a small tooltip:
- Price level.
- Bid volume / Ask volume.
- Delta.
- Imbalance ratio.
- Aggressor side.
Depth-profile tooltip
Hover the depth-profile side panel (CVD Profile, VRVP, Order-book Heatmap, Liquidation Heatmap) and the chart shows the corresponding price level highlighted with cell-specific data — volume at level, OI delta at level, liquidations clustered at level.
Multi-exchange depth tooltip
Hover the multi-exchange depth panel and the chart shows the per-venue depth tally at the cursor price — useful for spotting venue-specific liquidity holes.
Position-line tooltip
Hover any position line (entry / TP / SL / liquidation) and a tooltip shows:
- Position size.
- Side (Long / Short).
- Entry price.
- Distance to current in %.
- Estimated P&L impact if filled at this level.
Drawing tooltip
Hover any drawing for its label (if you set one in the edit popup), or its measure data (for the measure tool).
Timezone
Tooltip times honour your account's timezone setting (Chart settings → General → Timezone). Defaults to UTC. Common picks:
- UTC — venue-aligned.
- Local — your browser's timezone.
- Exchange-local — Asia/Shanghai for crypto, America/New_York for FX equity hours.
Common questions
My P&L cell is in red but my positions are green. The cell sums across positions. If you have one large losing position and several smaller winning ones, the net is negative. Hover for per-symbol breakdown.
Latency keeps spiking even though my network is fine. The latency cell measures round-trip to the venue, not to our server. Spikes typically indicate the venue's edge node has issues. The terminal still trades normally — orders queue and route on the next healthy round-trip.
Last-tick goes red on an illiquid symbol. The 10 s threshold is tuned for liquid majors. On illiquid alt-coins, lulls of 30-60 s are normal and the red signal is a false alarm. We're adding a per-symbol heuristic; until then, ignore the red on quiet pairs.
Sound toggle muted everything but alerts still pop up visually. Correct — the master sound toggle silences audio only. Visual toasts and the bottom-panel alert list continue. To suppress visuals too, mute per-indicator in the indicator panel.
Multi-account switching from the status bar didn't move my positions. Account-switching changes the active account. The positions you saw before were on the old account; they're still there, just not displayed. Switch back to see them again.
What's next
- Settings dialog & themes — toggle tooltips and timezone.
- Mobile experience — the mobile status bar is condensed; see what's kept and what's hidden.
- Auto Trade — the bot-status cell explained in depth.