TradingView Workspace Setup
Configure TradingView for serious chart reading — strip the defaults, retune the six chart-settings tabs for screen comfort, star the drawing tools you actually use, lock the layout with auto-fit and save it as a named preset.
A chart you stare at for eight hours a day is not a visualisation — it is your operating environment. Bright primary green / bright primary red bias your reaction speed, default scale lines pull the eye away from price, redundant header chrome eats vertical room you need for higher-timeframe context. Every serious trader running TradingView eventually retunes the workspace; this guide is the version we ship to our subscribers so you do it once, save it as a preset, and move on.
This page is about the workspace itself — chrome, palette, drawing tools, layout presets. Per-study configuration (Signals Premium, Smart Ranges, RSI Premium, mrDAlgo, Open Interest) lives in each study's own page. For adding the studies to your chart, see Link your account & add the studies.
Below is the end state — a TradingView chart after the chrome has been stripped, after the colour palette has been desaturated, ready to receive any indicator you want to layer on top.
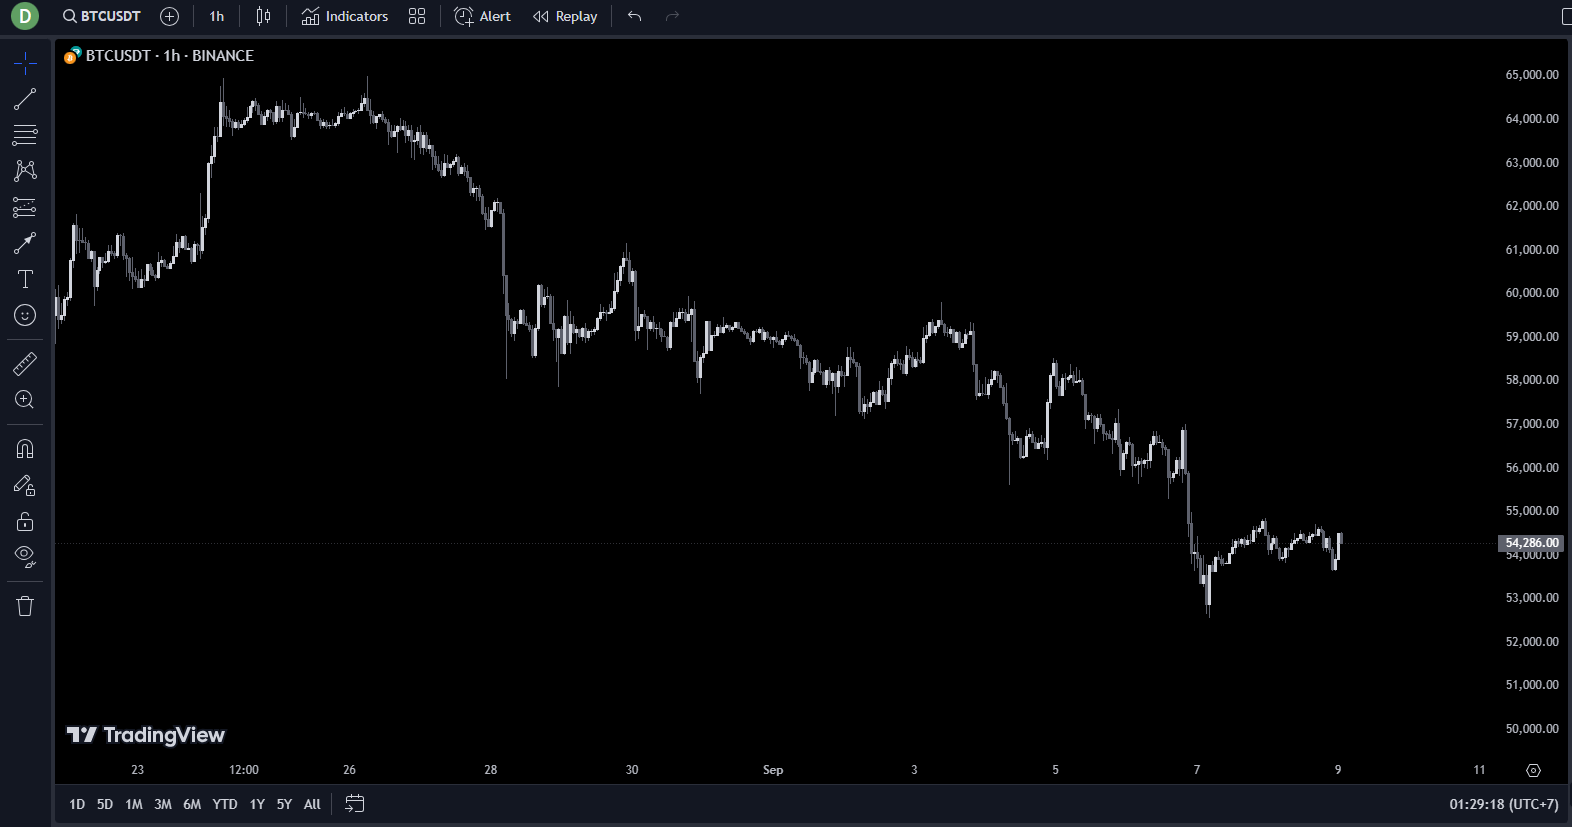 The post-configuration baseline. From here you can layer studies without the chrome fighting them for attention.
1. Strip the chart back to a baseline
Start from a fresh chart. The default layout ships with a Volume sub-pane that traders rarely read and that competes for vertical space with the indicators you will add later. Hover the Vol — BTC row at the top-left of the chart, click the trash icon, then Remove.
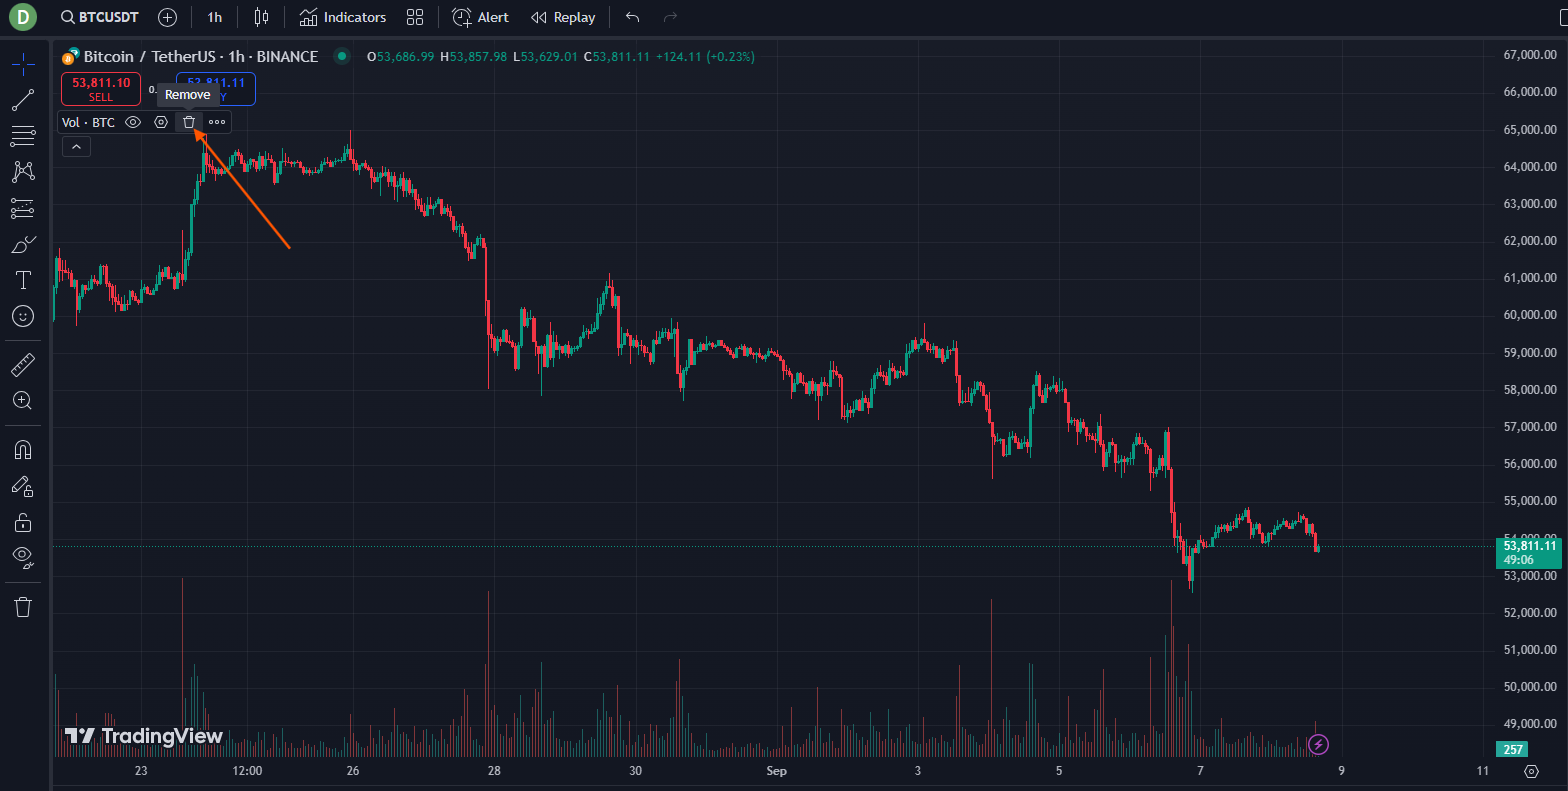 Click the trash → Remove. That sub-pane is real estate you want back for the RSI Premium pane below price.
Open Chart settings with right-click → Settings on the chart, or double-click any candle.
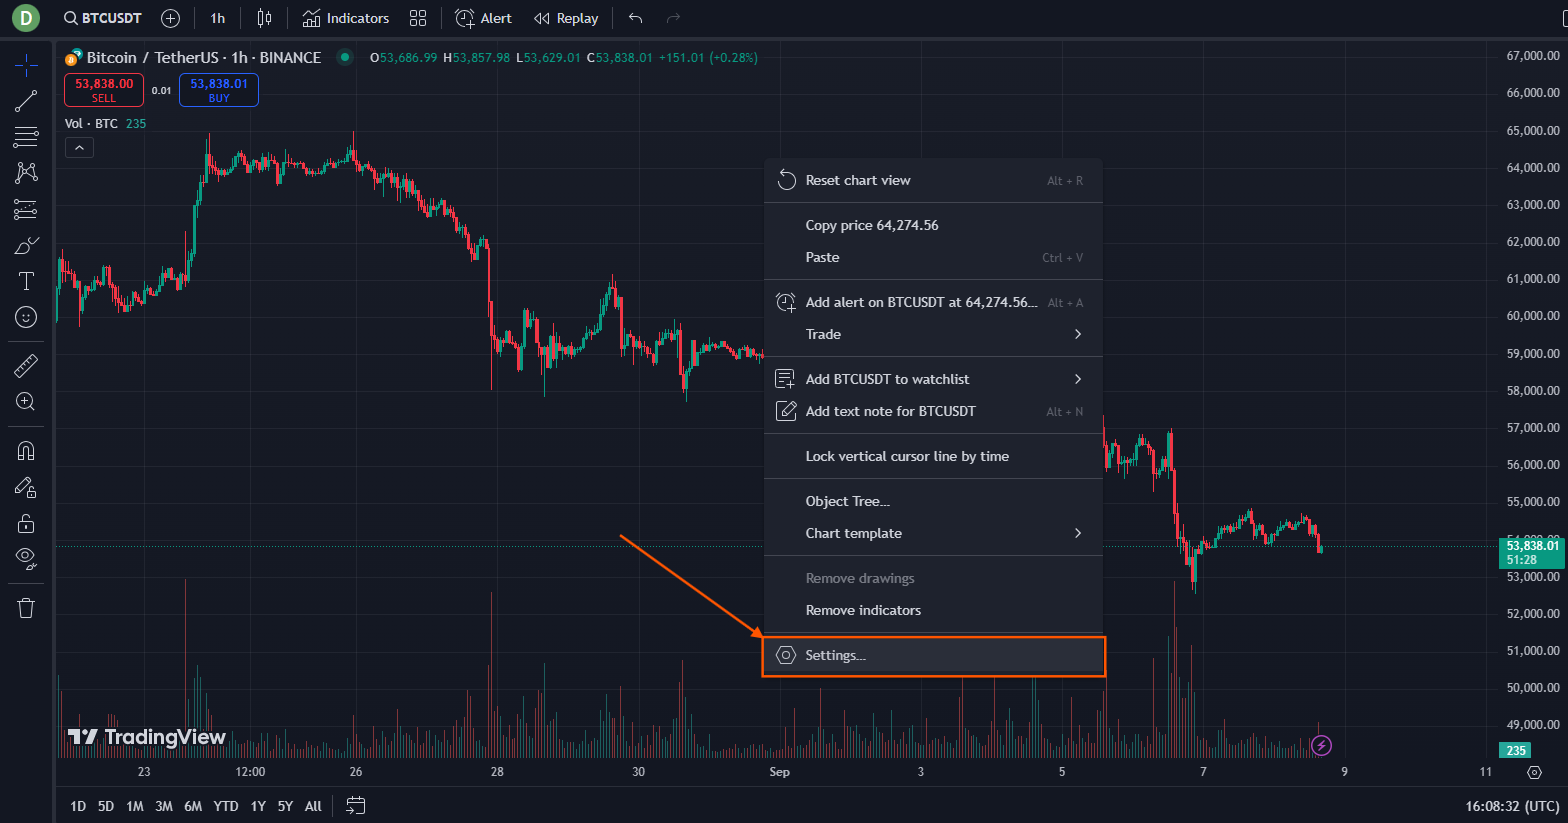 Right-click anywhere on the chart and pick Settings at the bottom. The same dialog opens on double-click.
2. Retune the six Chart Settings tabs
The Chart Settings dialog has six tabs. The default values are picked for "first-time visitor on the landing page", not for "trader executing 30 charts a day". Walk each tab once.
Symbol — candle colours and timezone
The first job is to kill the default bright green / bright red. Saturated primary colours trigger the reflex-decision part of the brain — the part that makes you click before you think. Use a desaturated palette that matches the candle tone you will see later when mrD studies overlay their own coloured candles.
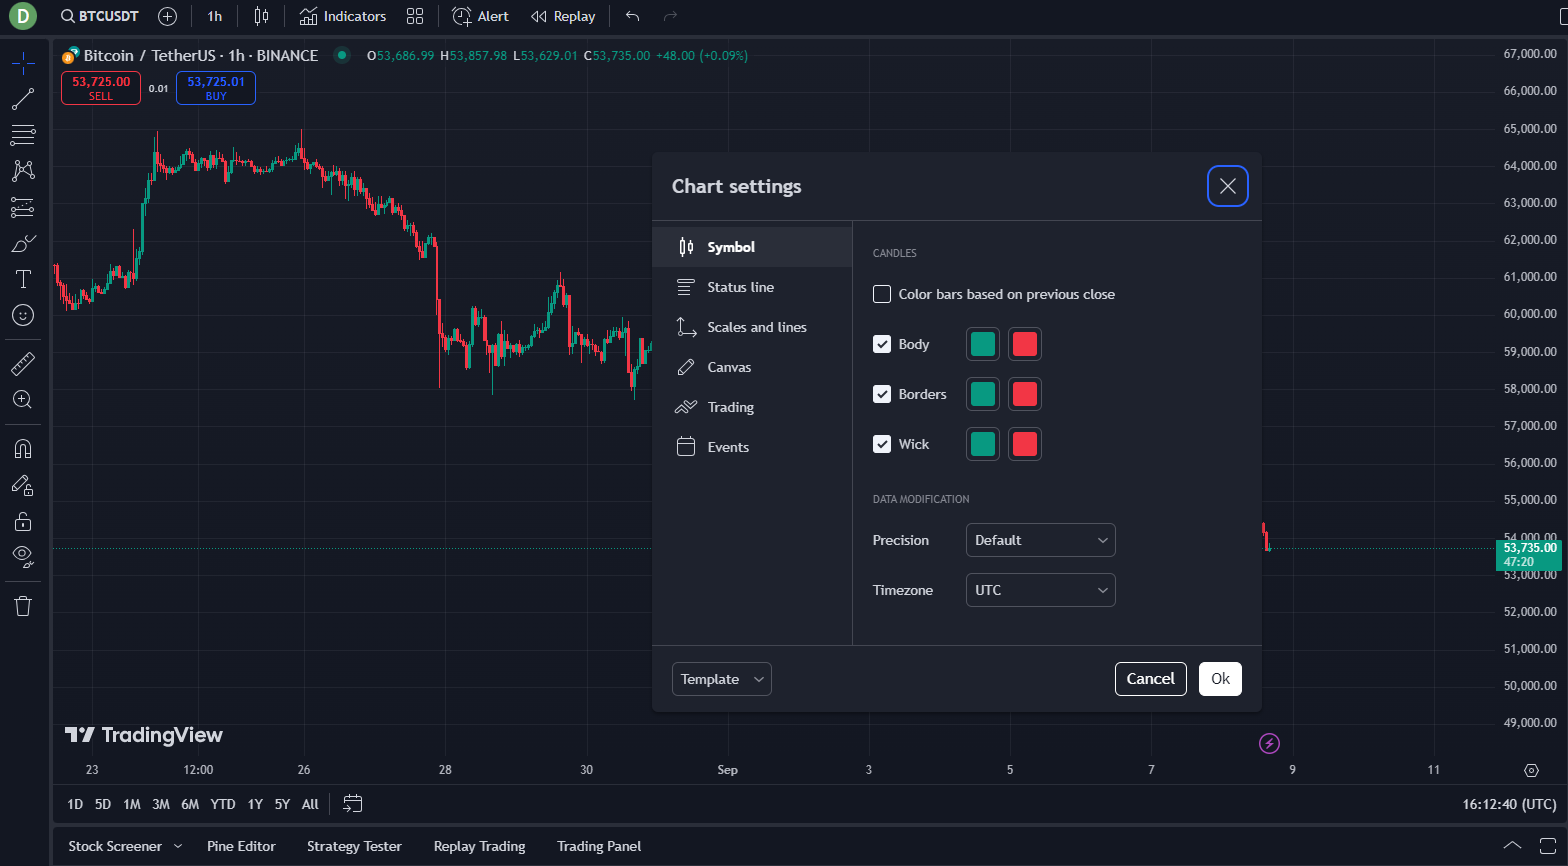 Default Symbol tab. The factory green/red is the part that biases reaction speed; replace it.
Also set Timezone to your local zone. UTC is fine if you trade pure crypto and think in UTC, but most traders read levels faster in their local time of day (London open, NY open, Asia open felt as "morning / afternoon / night").
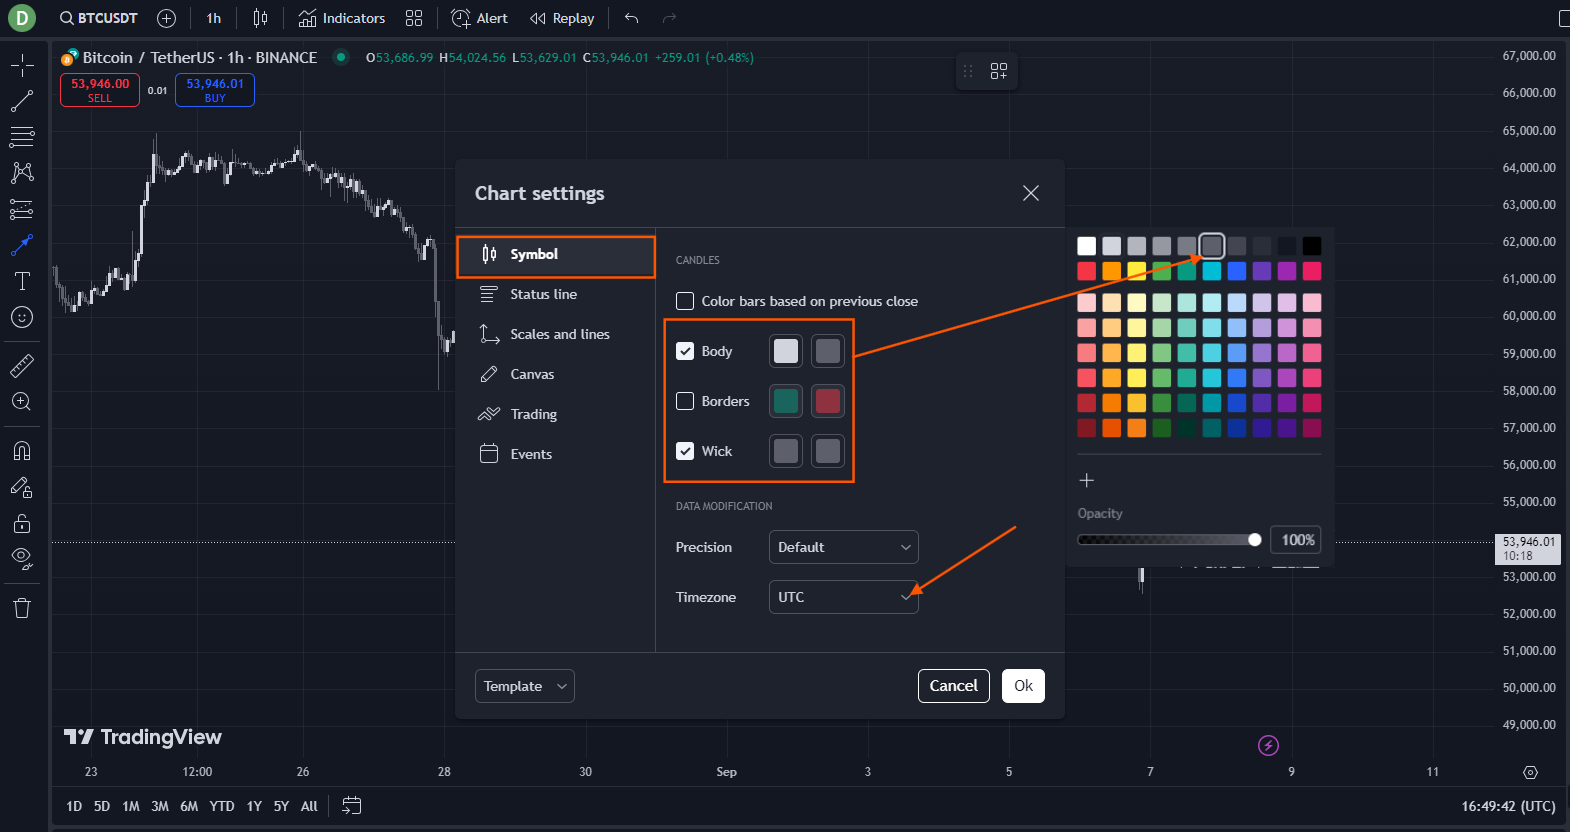 Body / Borders / Wick all retuned in lockstep. Pick a palette that will not clash with the mrD-Signals colour markers added in §5.
Status Line — keep only what you read
The status line is the row of metadata at the top-left of the chart (symbol, OHLC, change %, volume, indicator names). By default it shows everything. In live trading you only read two things from it — the symbol/timeframe label and the active indicator names — so strip the rest.
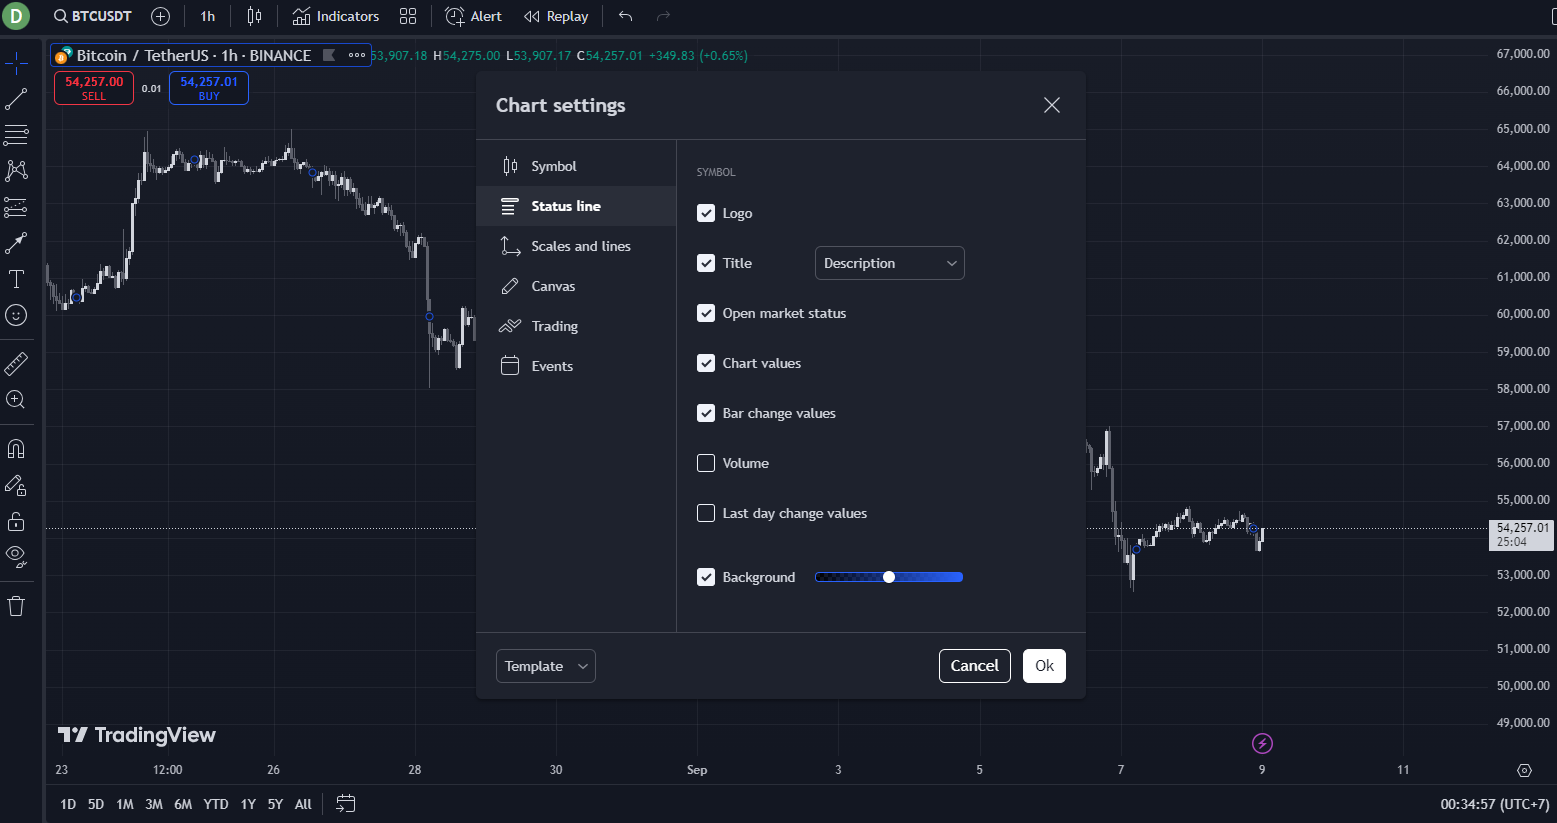 Default Status Line — too much. The OHLC numbers are already at the crosshair; do not duplicate them in the header.
Switch the Title mode to Ticker (compact), uncheck the noise items, keep Symbol, Indicator titles, and Indicator values so the mrD studies still print their version tag at the top of the chart.
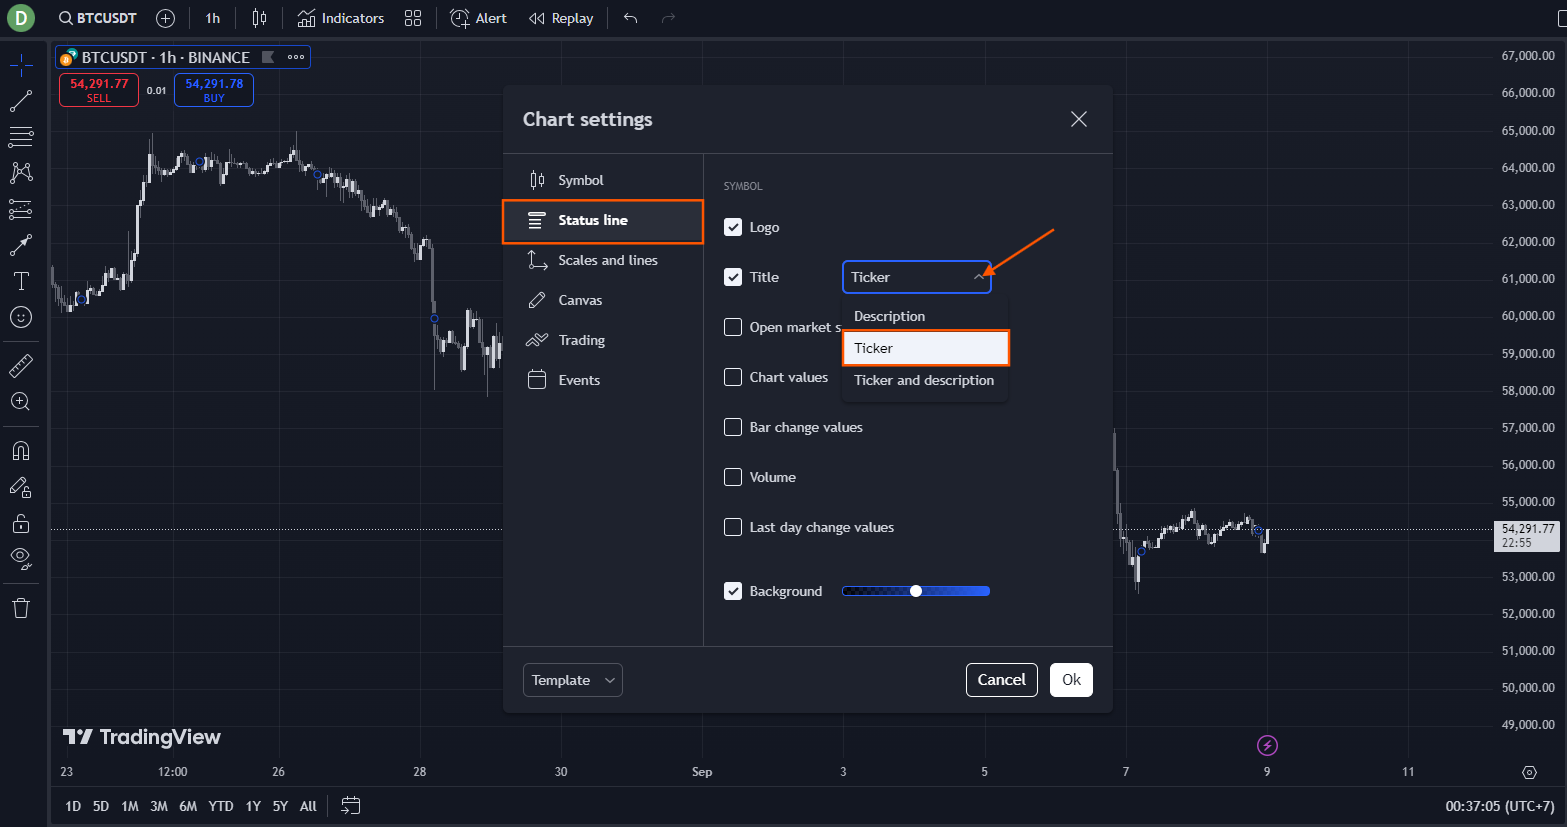 Ticker mode + only the rows you actually read. The header bar shrinks by ~40 px.
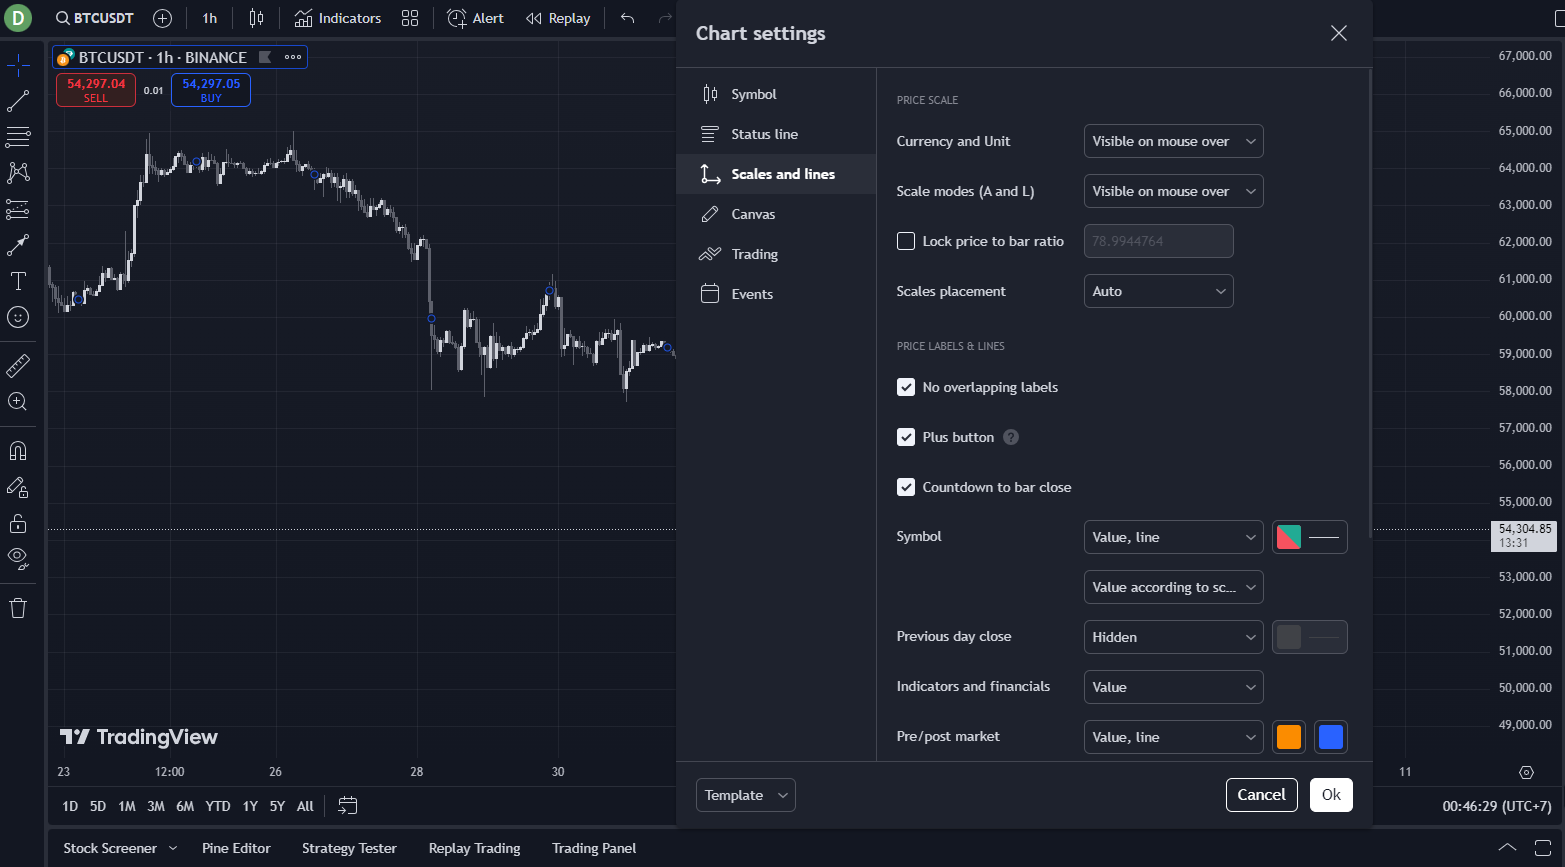
Scales and Lines — soften the chart frame
The default crosshair / horizontal line / vertical line / price line all paint with full opacity. They cut through the price action. Drop the line opacity to 30–40 % so the price axis stays visible but the chart structure stays primary.
 Default lines compete with the candles. The crosshair especially "cuts" the chart on every mouse move.
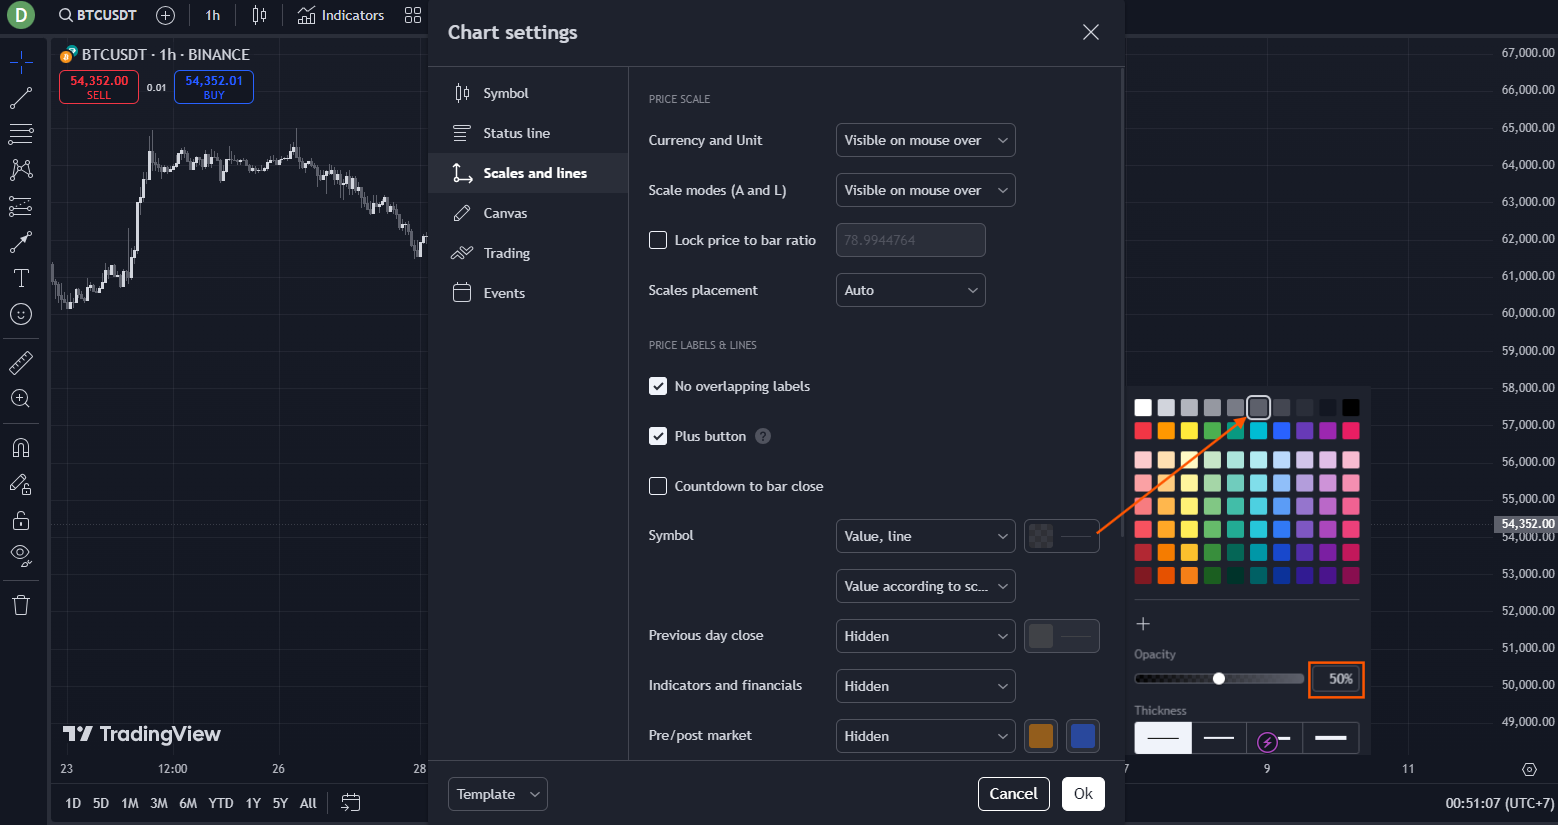 Same tab, softened. Crosshair stays visible enough to read prices, faint enough to not slice the chart.
Then, in the same tab, set the irrelevant rails to Hidden — most retail traders never use the prev-day high marker, the bid/ask line, or the high-low price line. Hiding them is a one-time cleanup that you will never miss.
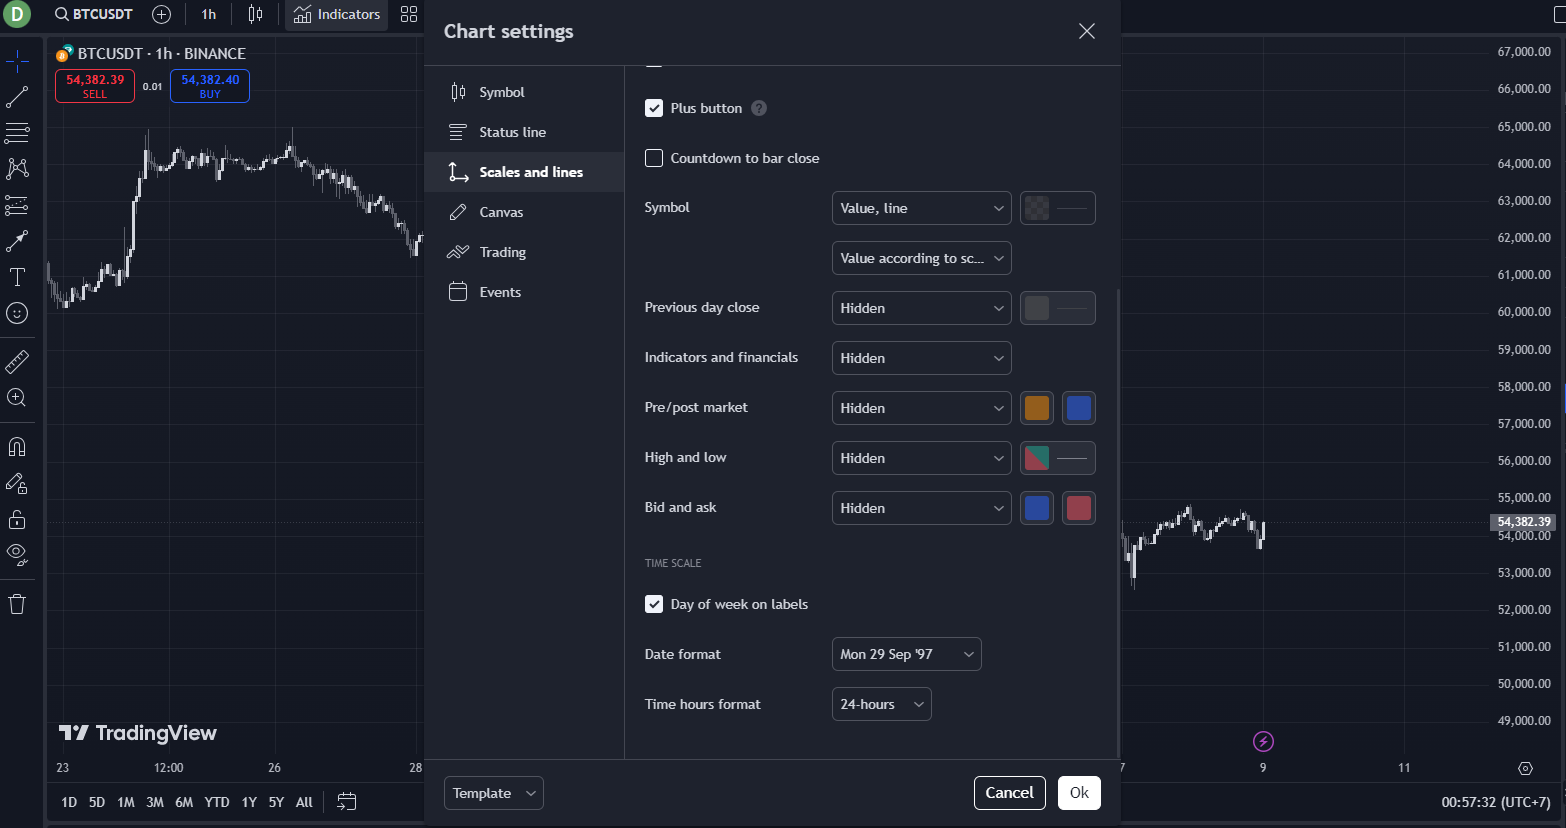 Anything you do not actively read — Hidden. The right-side scale stays clean and the eye is not drawn to dead chrome.
Canvas — background, grid, and watermark
The Canvas tab controls the chart background and grid lines. Two changes matter:
- Pick a background tone that does not flare under your studio lighting. Pure black
#000shimmers under fluorescent lights; soft near-black#0E1116is what professional terminals (Bookmap, Sierra Chart, IBKR TWS) ship as their default for a reason. - Set Grid lines to None. The grid is a relic of paper-charting; on a candle chart it adds visual noise and obscures wicks at the boundaries.
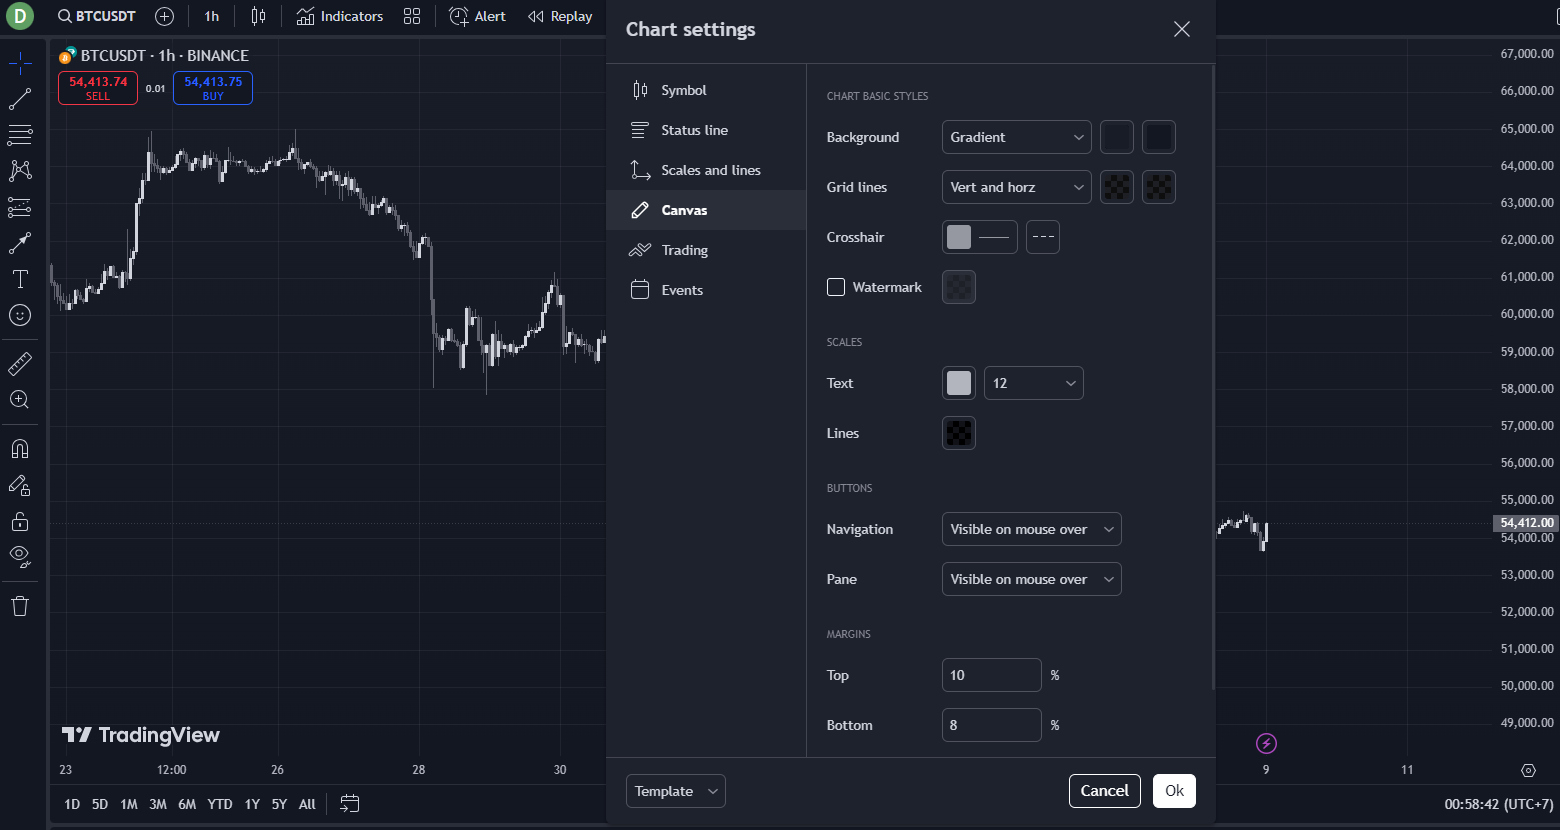 Default Canvas. Grid lines on means every candle wick competes with a faint vertical line behind it.
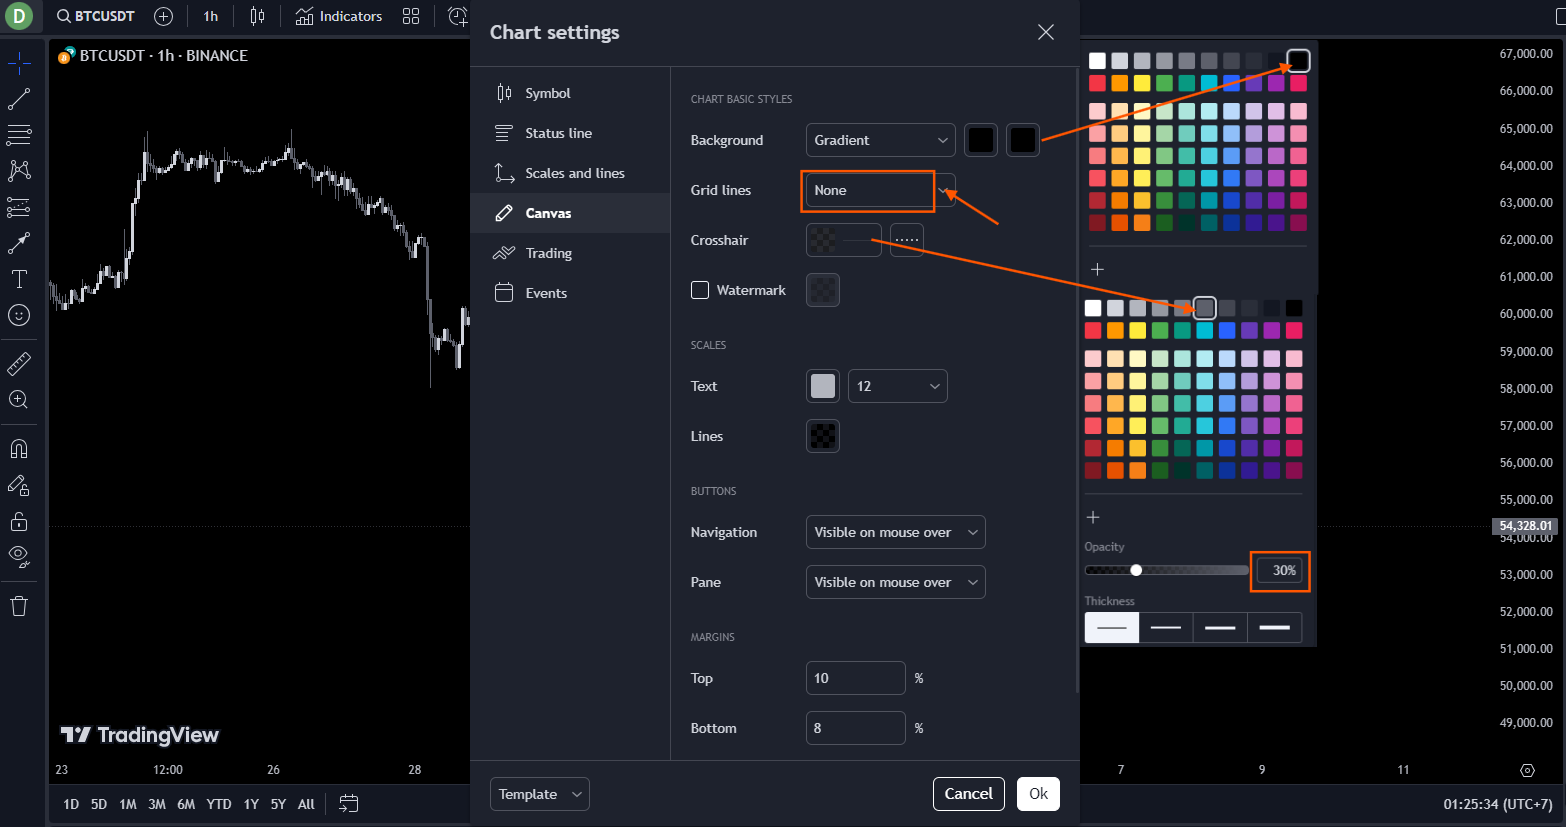 Background soft, grid off, watermark muted. The canvas becomes a clean substrate for the indicator paint to land on.
Trading — disable the Buy / Sell pill
The floating BUY / SELL pill at the top-left of the chart is meant for one-click execution through a connected broker. If you are charting in TradingView but executing on Binance / Bybit / your exchange of choice, that pill is a misclick waiting to happen.
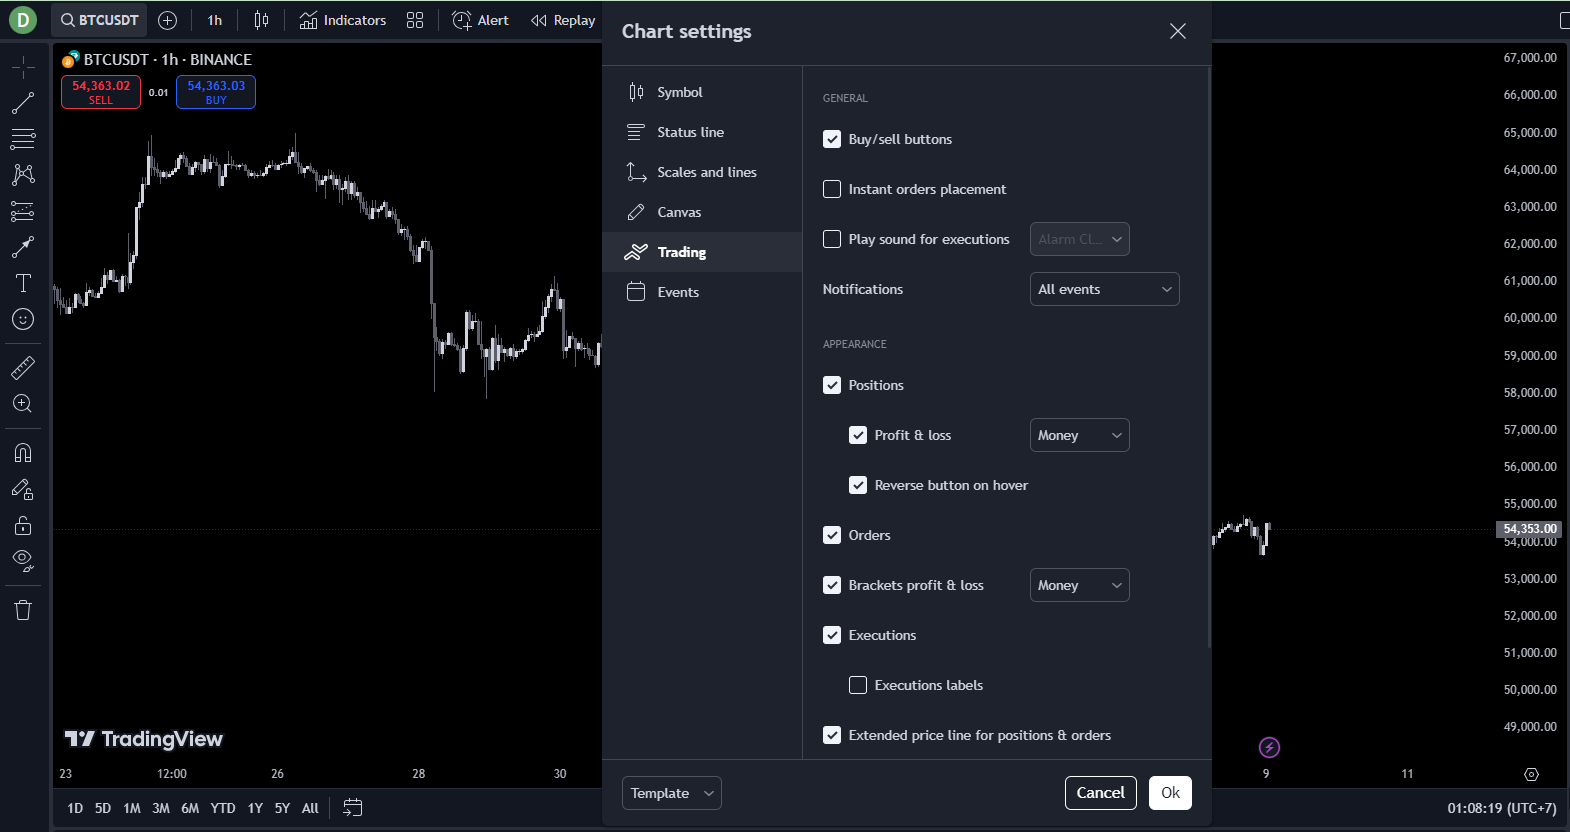 Default. If you do not use TradingView's broker integration, leave nothing here that can fire an order.
Uncheck Buy / Sell buttons. If you DO use the broker integration, leave them on but at least move them out of the chart's top-left corner where the indicator status line sits.
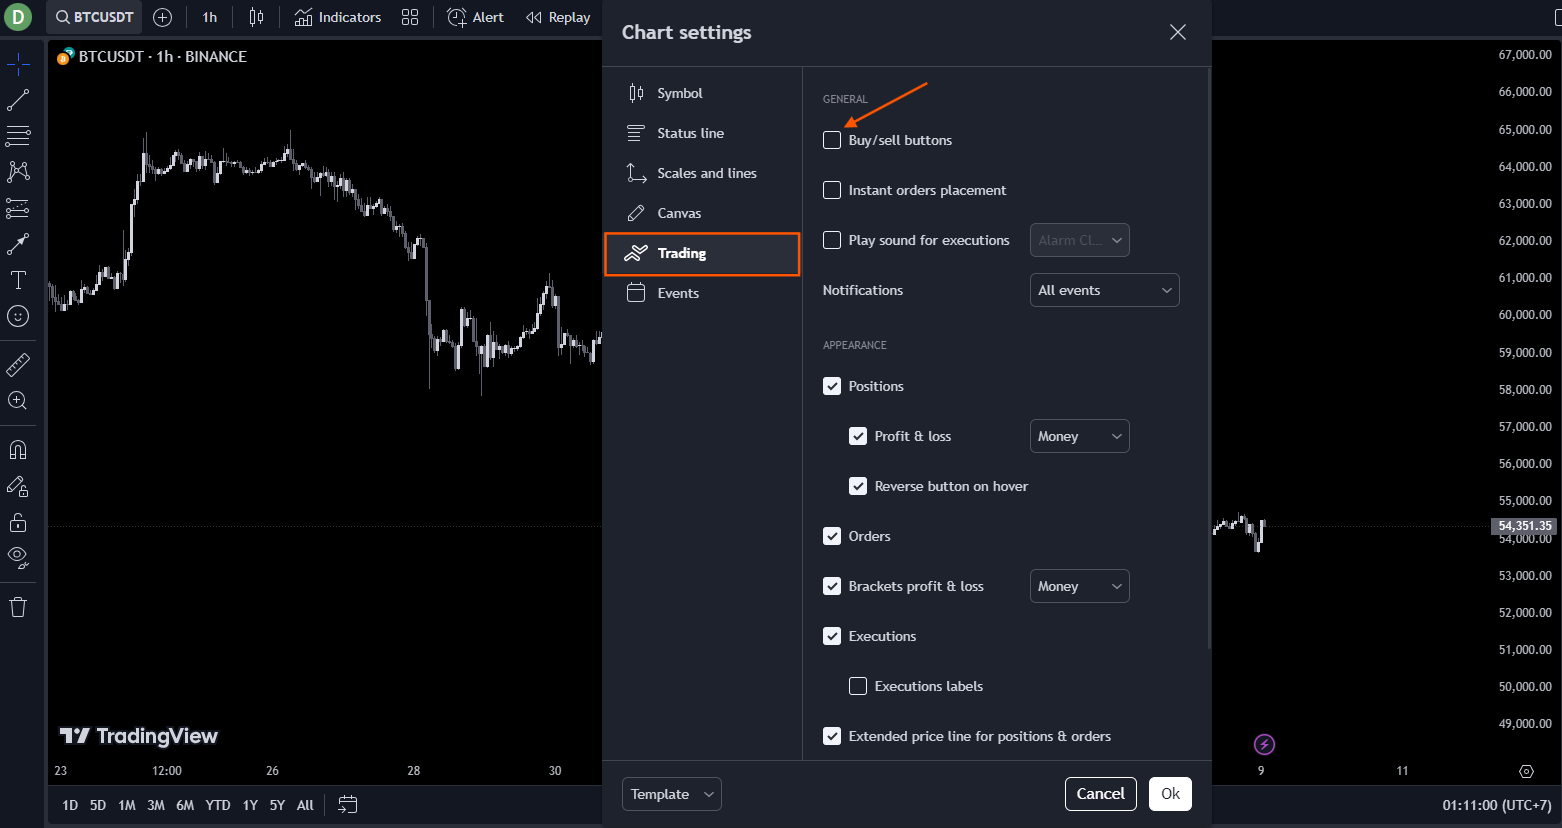 Disabled. One fewer thing painted on top of price.
Events — strip the marketing noise
The Events tab paints things like earnings flags, dividend marks, and economic-event icons directly on the chart. In crypto / FX, most of this is irrelevant; even on equities most active traders read events from a separate calendar, not from chart icons.
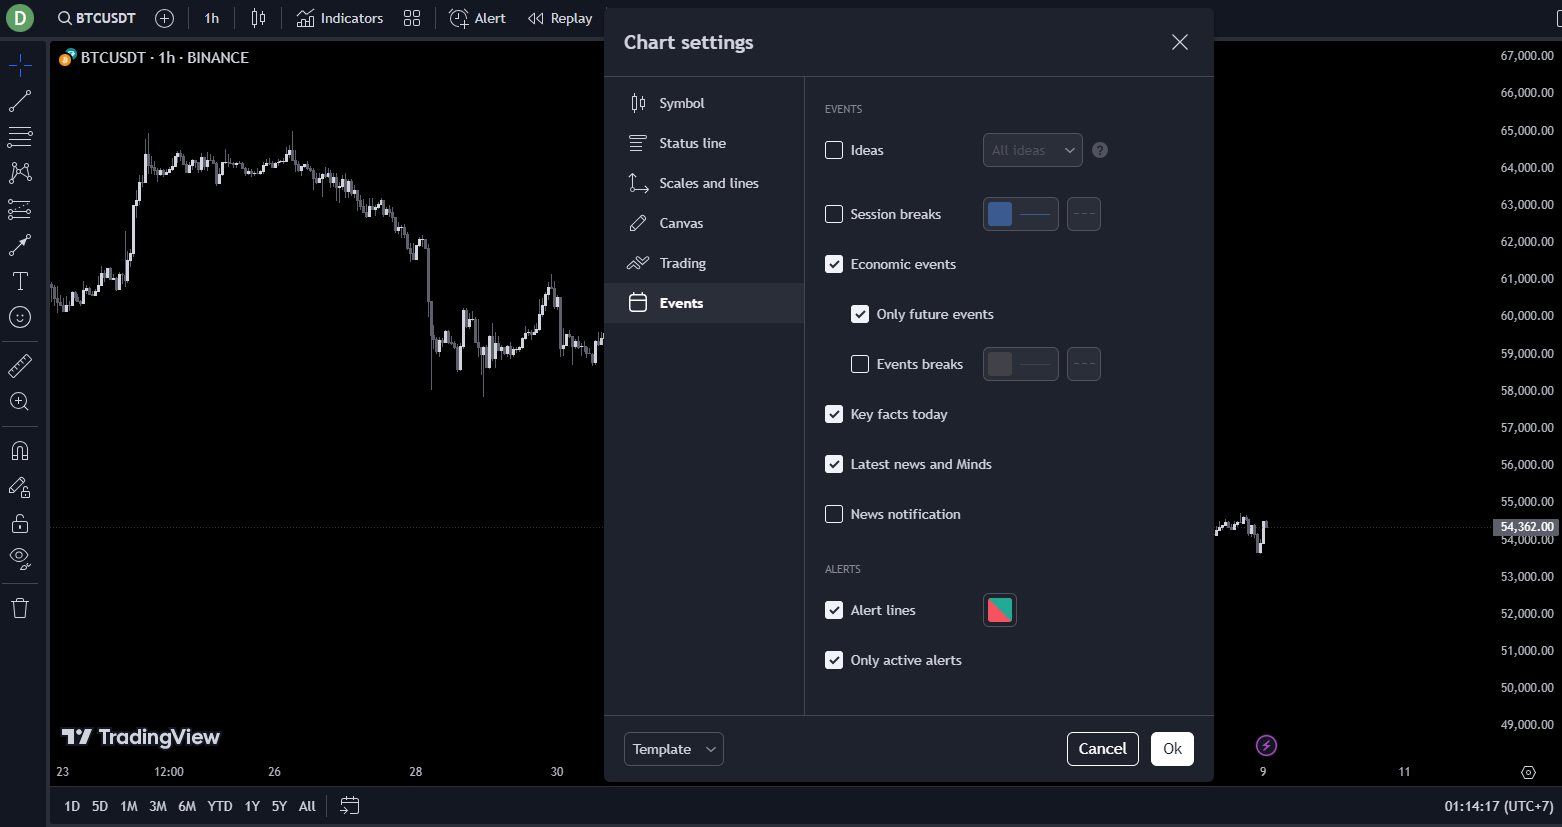 Default Events. Most active-trading workflows do not read this on the chart.
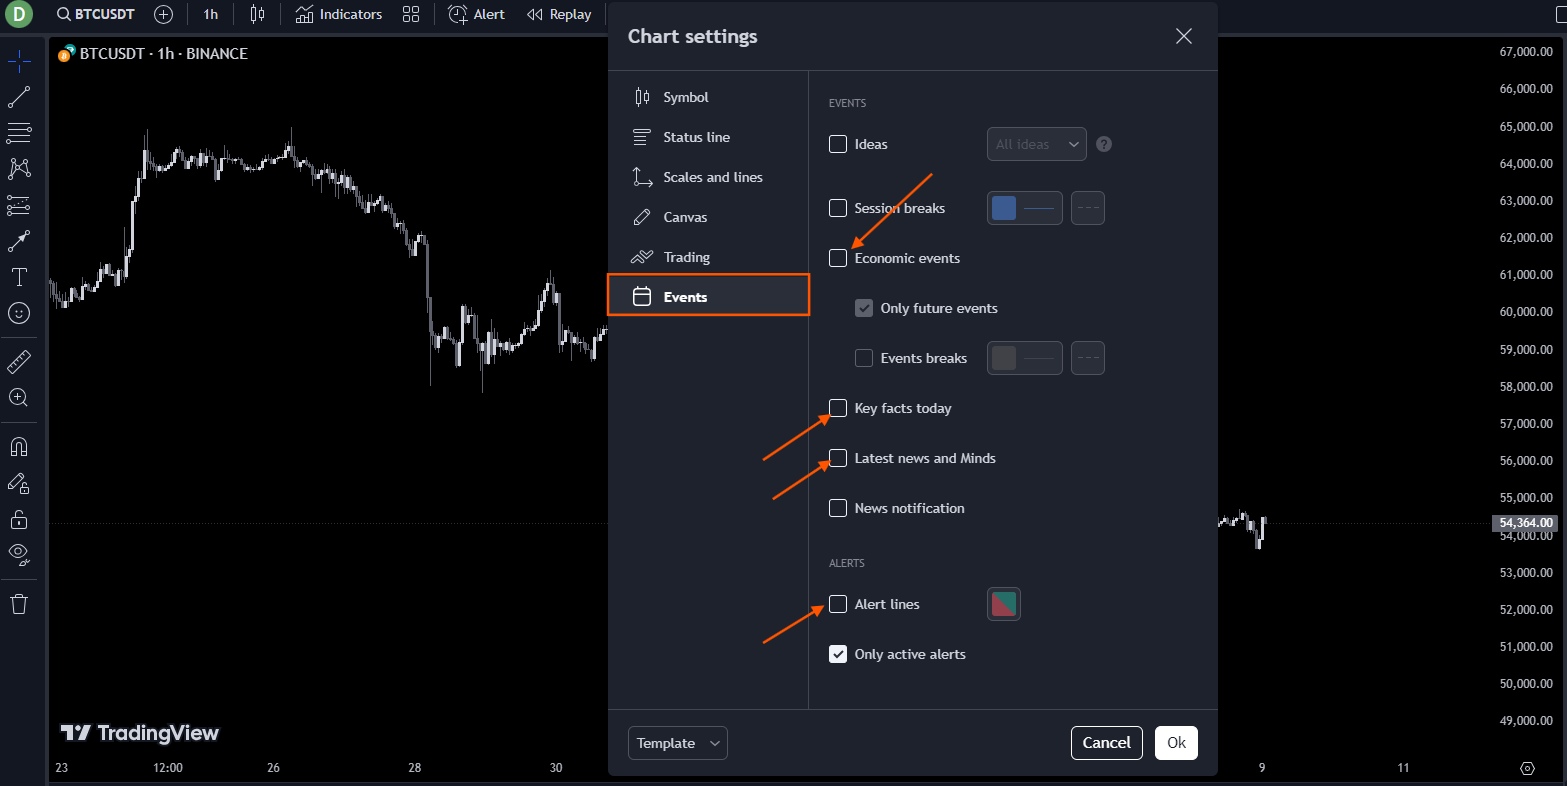 Disable what does not apply to your asset class. Empty Events = no surprise flag painting on top of price.
3. Star the drawing tools you actually use
TradingView ships ~30 drawing tools in the vertical toolbar. Pros use four to seven of them daily — horizontal lines, trend lines, parallel channels, Fibonacci retracements, rectangles, and text. The rest you reach for once a month.
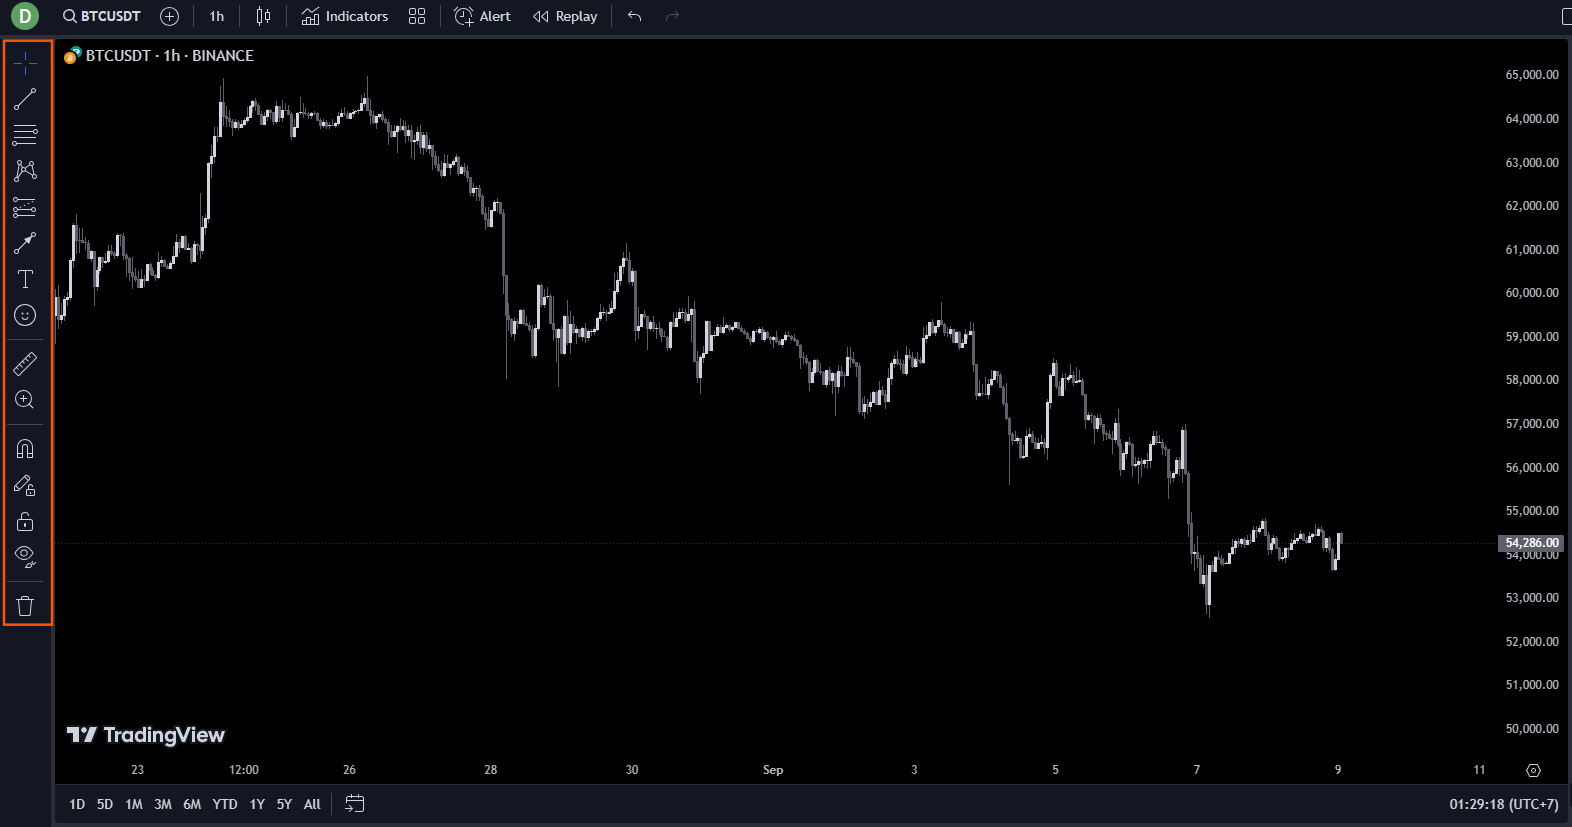 Default toolbar. Too long, too many cold tools between the warm ones.
Right-click a tool you use → Add to favourites (star icon). Repeat for every tool you actually reach for in a session. Then drag-reorder them into the workflow order you naturally use them in (trend line first, horizontal next, Fib after, etc.).
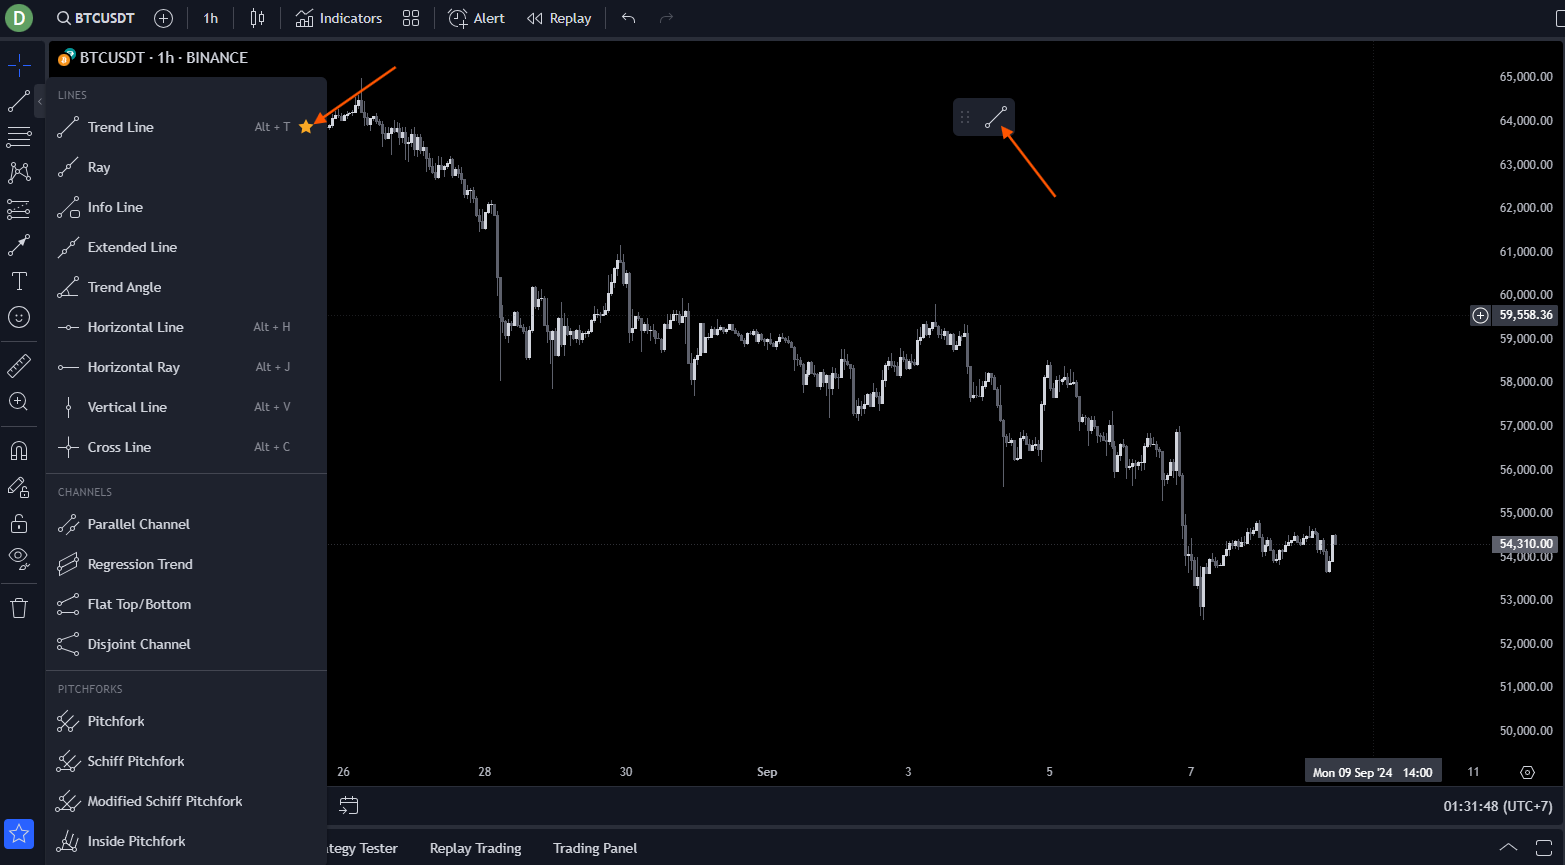 Stars + reorder. The hand moves to the same screen coordinates every time, which is how you build draw-speed.
The star icon at the bottom-left of the chart toggles between favourites-only and all tools mode. Keep it on favourites-only during active trading; flip to all-tools only when you need something rare.
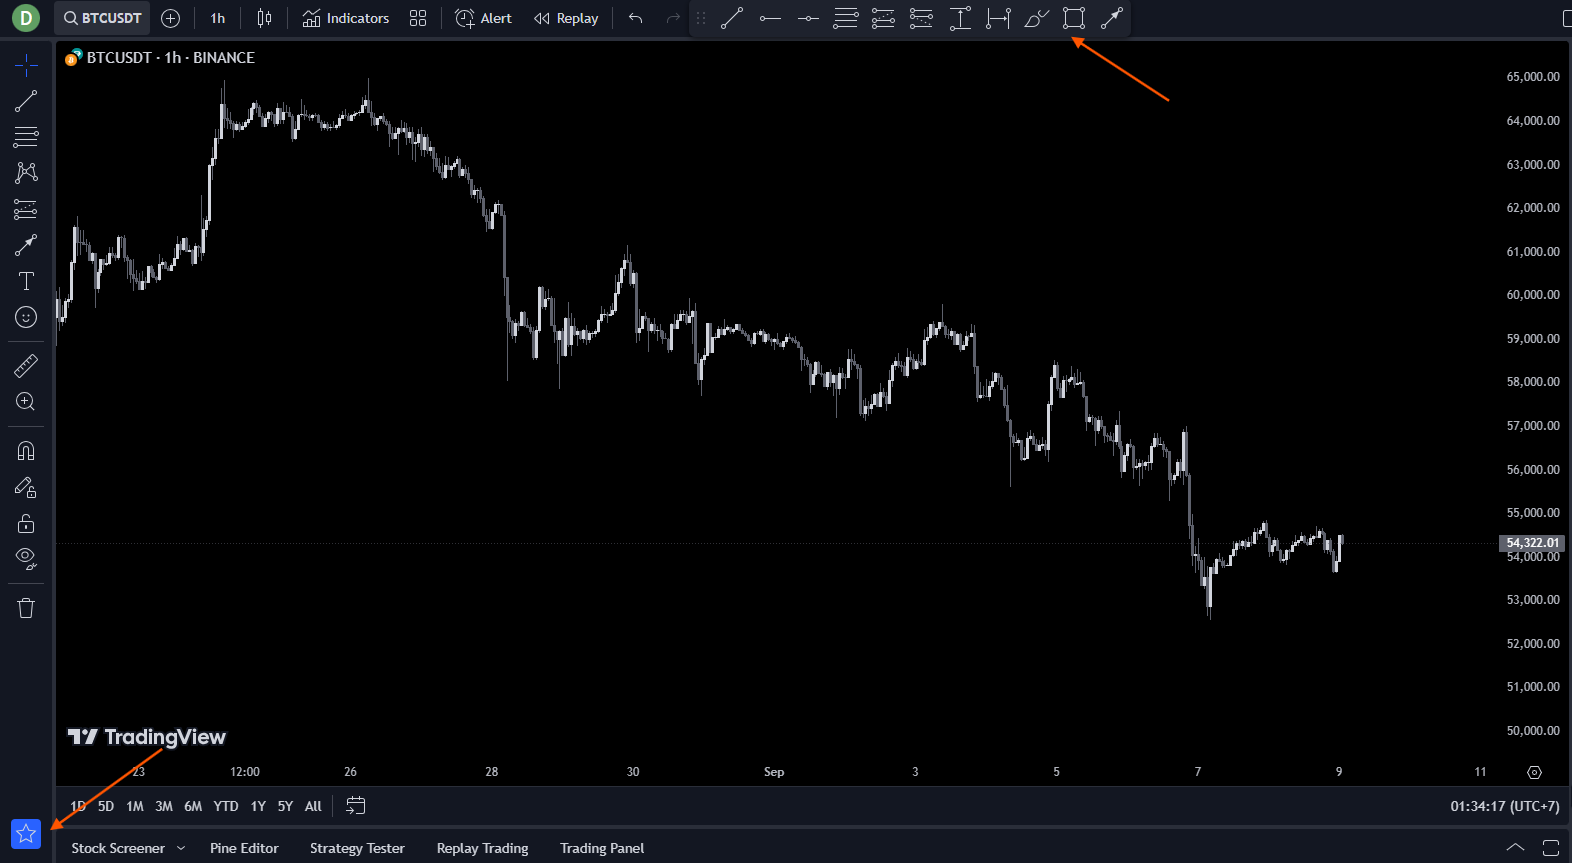 Favourites-only during the session, full toolbar when you genuinely need the rare ones.
4. Lock the layout — auto-fit and Save As
With the chrome stripped, the palette desaturated, and the drawing tools starred, the workspace is now in a state you want to freeze so a stray drag or a fresh browser session does not reset it.
Click the scale settings cog at the bottom-right of the chart and select Auto (fits data to screen). This makes the chart auto-rescale on every timeframe change so price is always centred in the viewport — without it you spend the first second of every TF switch dragging the price scale up or down to find the candles.
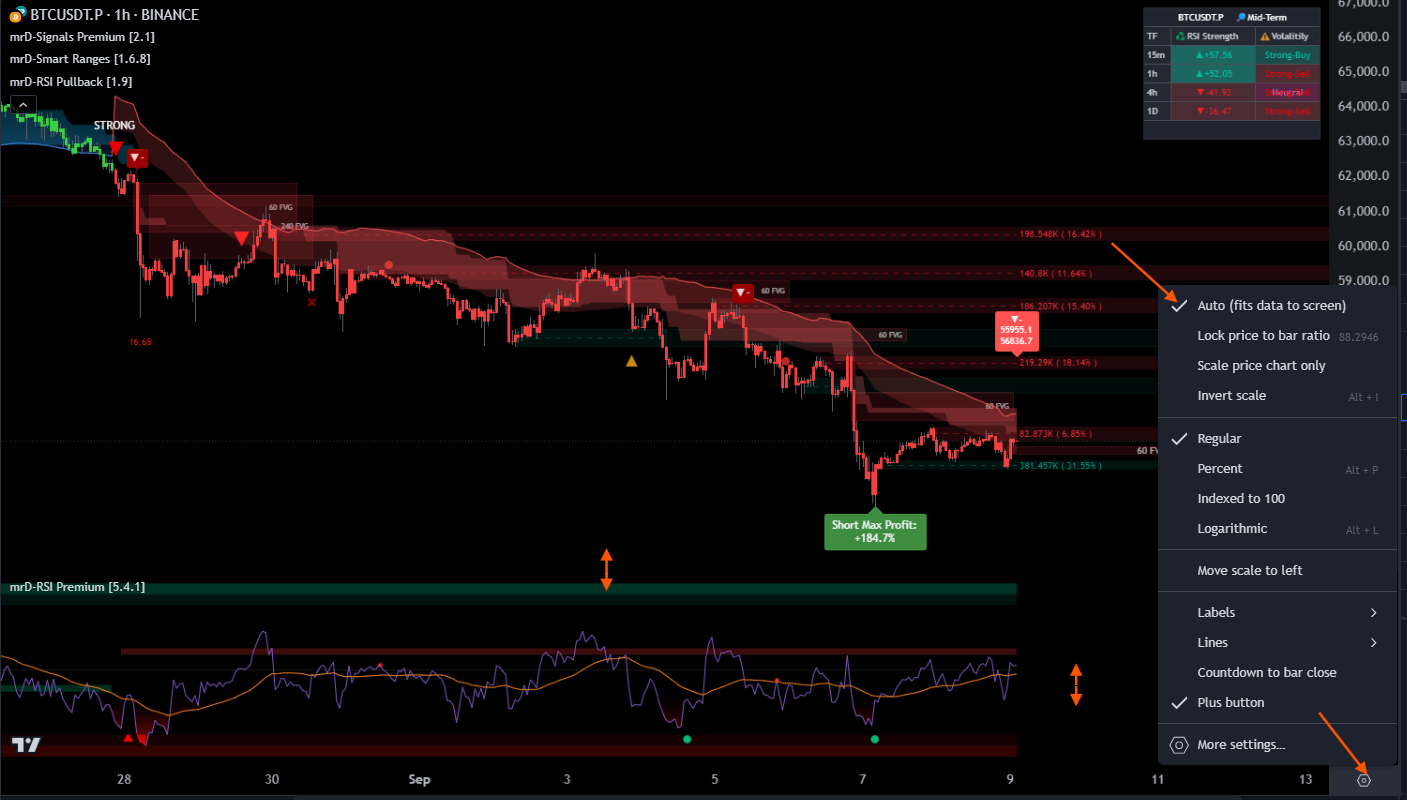 Auto-fit on. Resizes price to the viewport on every TF switch — saves the manual scale-drag.
Finally, save the layout as a named preset. TradingView's layout system lets you keep many named presets — most active traders end up with at least three:
- A Scalping layout (1m / 5m, dense pane stack).
- A Swing layout (1h / 4h, more vertical room for higher-timeframe context).
- A Backtest layout (Bar Replay mode on, minimal indicator stack so the replay performance stays smooth).
Click the layout-name dropdown at the top-right of the chart → Save As, give it a descriptive name, save. From now on, switching presets restores the exact workspace you just configured — chrome, palette, drawing favourites, pane splits, the lot. You can also share a preset across charts by re-saving the same name after every change.
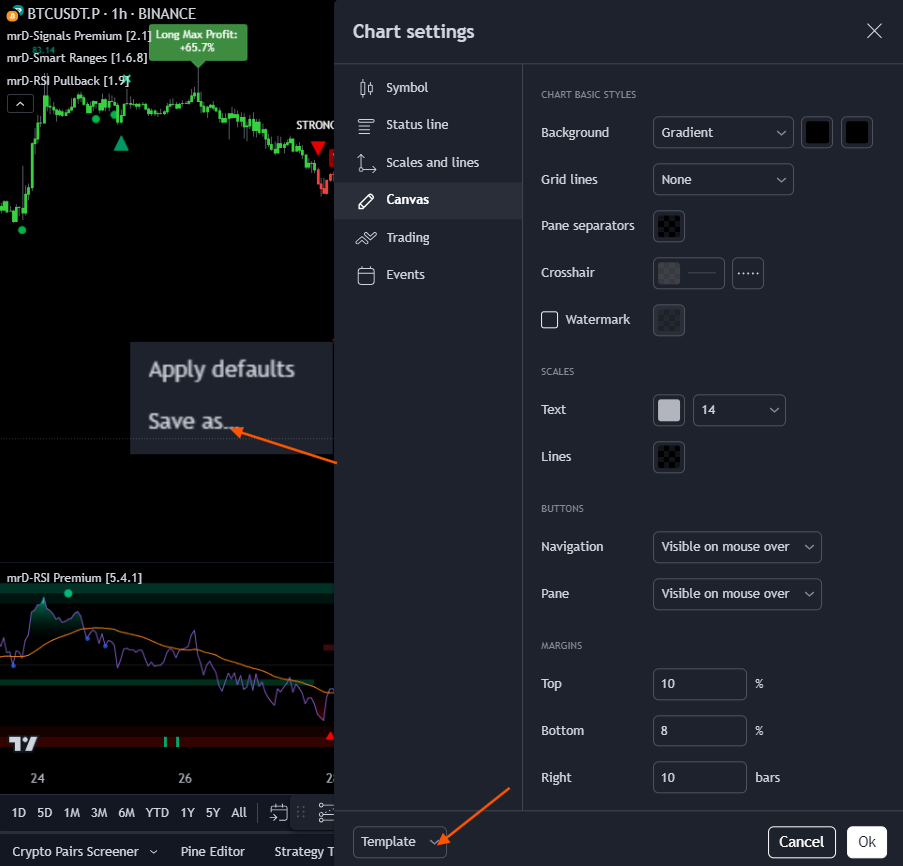 Save As. Build one preset per workflow (scalp / swing / backtest), switch between them in one click.
Where to go next
The workspace is now production-ready. Next:
- Link your account & add the studies — paste your TradingView name into the mrD profile, then add the invite-only studies from Indicators → Invite-only.
- TradingView Indicators introduction — what each mrD study does and how they fit together in a workflow.
- Chart Terminal overview — the same mrD models painted natively in our chart terminal, with depth heatmap and footprint on the same screen.