S/R Volume Zones
S/R Volume Zones inside mrD-RSI Pullback — auto-drawn supply / demand zones from pivot highs / pivot lows with extreme volume spikes. Full reference for the green "S" support boxes and red "R" resistance boxes, the Fresh ★ marker (untested zones, highest reliability), tooltip metadata (zone type, retest count, volume share, top / bottom prices), four entry use cases, eight trading tips, limitations, and the advanced "zone + Hidden Div" + "zone cluster" combos.
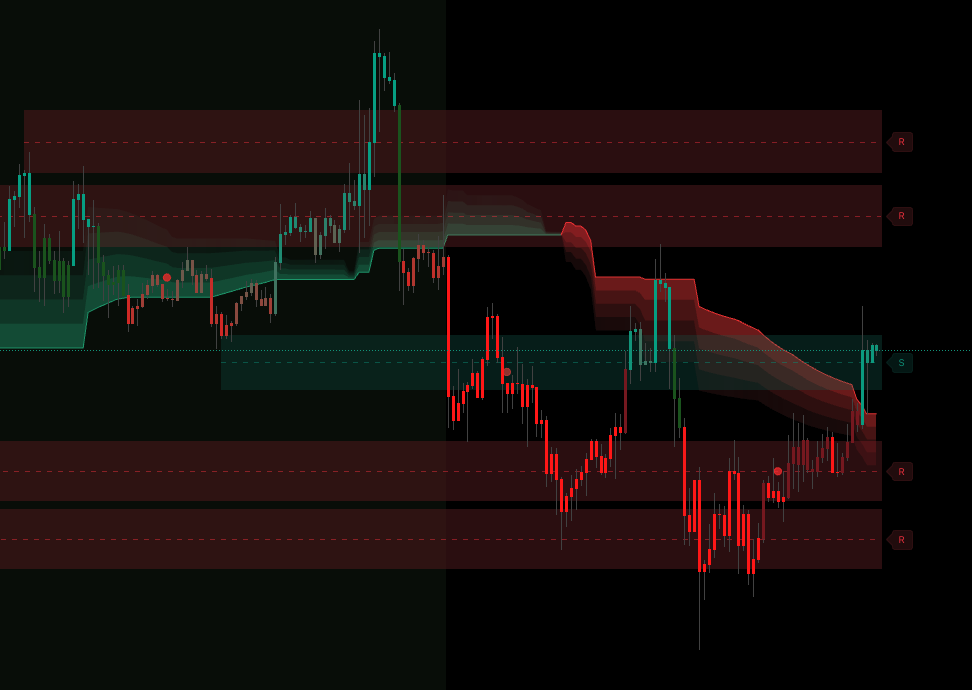
S/R Volume Zones are the structural-levels layer of mrD-RSI Pullback. The indicator scans the chart history for pivot highs / pivot lows that occurred alongside extreme volume spikes, then draws colored boxes at those price areas — green "S" boxes for supports and red "R" boxes for resistances. When price returns to these zones, reaction probability is high: either a clean rejection (rebound) or a breakout with volume confirmation.
This page is the complete reference for the S/R Volume Zones module. The zones are the most precise stop-loss and take-profit anchors the study provides — every entry should reference them.
 The boxes are auto-drawn from volume-spike pivots. The star marker tags zones that have not been retested yet — those are the highest-reliability entries.
1. What are S/R Volume Zones?
The indicator scans price history to find pivot highs / pivot lows that occurred together with extreme volume spikes. At each of those points it draws a coloured box representing an important price zone:
- Green box with "S" — Support Zone (demand zone, where buyers stepped in heavily).
- Red box with "R" — Resistance Zone (supply zone, where sellers stepped in heavily).
When price returns to these zones, reaction probability is high — either rejection (rebound) or breakout with volume confirmation.
2. Enable / disable S/R Volume Zones
Open Settings → group Display → S/R Volume Zones
| Option | Effect |
|---|---|
| None | Off — no zones drawn |
| S/R Volume | On — draw Support / Resistance zones by volume |
Recommendation: enable for all trading styles. This is the most precise TP / SL tool the study provides.
3. Reading boxes and labels
Green Support Zone (green box + "S")
Represents: a price area where buyers won big (pivot low + high volume).
Actions:
- Price descends into the zone → may bounce → BUY setup.
- Price breaks down through the zone with high volume → support broken → flip bias to short.
Red Resistance Zone (red box + "R")
Represents: a price area where sellers won big (pivot high + high volume).
Actions:
- Price rises into the zone → may reverse down → SELL setup.
- Price breaks up through the zone with high volume → resistance broken → flip bias to long.
Tooltip info
Click the "S" or "R" label to see a tooltip with:
- Zone type — SUPPORT / RESISTANCE.
- Fresh status (★) — zone untested, high reliability.
- Retest count — how many times the zone has been tested.
- Volume % — share of volume relative to all displayed zones.
- Top / Bottom — upper / lower price of the zone.
4. ★ FRESH Zone — the golden zone
A zone with the ★ symbol is a Fresh Zone — never tested back by price.
Why is the Fresh Zone special?
- Liquidity is intact.
- First reaction is usually strongest.
- Stop-losses of previous traders are still nearby.
→ Trade Fresh Zones with the highest confidence.
After the first test, the zone becomes a regular zone (no star) — still useful but reliability decays with each retest.
5. How to use for entries — four use cases
Use case 1 — BUY entry from Support Zone
Setup:
- Stable green cloud.
- Price descending into a Support Zone (green box, ideally ★).
- ▲ BUY signal fires inside the zone.
Action:
- Entry — at signal or market.
- SL — just below the zone bottom.
- TP1 — top of the zone or R:R 1:1.
- TP2 — next Resistance Zone.
Use case 2 — SELL entry from Resistance Zone
Setup:
- Stable red cloud.
- Price rising into a Resistance Zone (red box, ideally ★).
- ▼ SELL signal fires inside the zone.
Action:
- Entry — at signal.
- SL — just above the zone top.
- TP1 — bottom of the zone or R:R 1:1.
- TP2 — next Support Zone.
Use case 3 — Breakout trade with volume confirmation
Setup:
- Price compressed near a Resistance Zone for many bars.
- Explosive breakout candle + high volume (Vol Ratio ≥ 2.0× in Info Table).
- Cloud also green.
Action:
- Entry — after the breakout bar closes (confirmed).
- SL — below the zone just broken (now new support).
- TP — next Resistance Zone.
Use case 4 — Place SL precisely
Even if not trading the zone directly, always place SL just outside the nearest zone:
- Long: SL below the nearest Support Zone below price.
- Short: SL above the nearest Resistance Zone above price.
→ Avoid stop hunts — market makers often sweep stops just inside zones.
6. Eight tips for using S/R Volume Zones effectively
Tip 1 — Prioritise Fresh Zones
The first test of a zone (Fresh ★) typically has the highest reaction probability. After 2–3 retests, the zone weakens.
Tip 2 — Check Volume % in tooltip
High Volume % = more important zone. Zones with 30%+ volume = "heavyweight" zones, very reliable.
Tip 3 — Combo zone + signal + cloud = A+ setup
A Pullback Signal firing inside a zone aligned with the cloud = A+ setup. Enter confidently, target R:R 1:3.
Tip 4 — Count retests
Each test (price returns + bounces) increments the retest count. The tooltip shows it.
- Retest 0–1: strong zone, trustworthy.
- Retest 2–3: average zone.
- Retest 4+: zone is weakening, may break.
Tip 5 — Watch zone spacing
If a Support and Resistance are close together (< 1% of price) = market is squeezing, big breakout coming → mentally prepare.
Tip 6 — Larger TF = more important zones
Zones on Daily / Weekly are real structure, hold for months. Zones on 5m are short-term noise. Check zones on both TFs (e.g. 1H + 4H) before trading.
Tip 7 — A broken zone often becomes the opposite
- Resistance broken upward → becomes new Support.
- Support broken downward → becomes new Resistance.
Ideal for re-entry after breakout.
Tip 8 — Do not trade right at zone edge
Wait for price to enter the zone interior before deciding. Trading at the edge often gets faked out.
7. Limitations of S/R Volume Zones
| Limitation | Workaround |
|---|---|
| No zones in long sideways | Market lacks strong pivots — switch asset. |
| Zones appear late (need pivot confirmation) | Tradeoff for quality. |
| Low-liquidity assets = few zones | Switch to high-liquidity assets. |
| Few zones on new charts | Wait for more data, or use HTF zones. |
8. Common mistakes
| Mistake | Fix |
|---|---|
| Trading immediately when price touches the zone edge | Wait for price inside zone + signal confirmation. |
| Ignoring Volume % in tooltip | Volume % is the most important zone metric. |
| Placing SL inside a zone | SL must be OUTSIDE the zone — avoid stop hunts. |
| Trusting a 5+ retest zone | Zones decay with retests — do not trust absolutely. |
| Trading without nearby zones | Skip — wait for a zone to form. |
9. Three advanced use cases
Advanced A — Zone + Hidden Div = golden setup
- Green cloud.
- Price pulls back into Support Zone (★ Fresh).
- Green Hidden Bullish Divergence dot appears in zone.
- ▲ BUY signal fires.
→ A+++ setup — extremely high win rate, full size, R:R 1:3+.
Full Hidden Div reference: Hidden Divergence.
Advanced B — Zone Cluster (supercritical zone)
When you see 2–3 zones overlapping (e.g. two Support Zones close together) → that area is super strong, will hold firmly. Prefer trading reactions from cluster zones.
Advanced C — Broken zone + retest
- Resistance Zone breaks up with high volume.
- Wait for price to retest (now new Support).
- ▲ BUY signal fires when retest holds.
- → Enter long, target the next level.
Common questions
Why do I sometimes see no zones? The indicator only draws zones when there is a pivot high / low + volume spike. In sideways or with little data, there may be no zones. This is a feature — only "real" zones drawn.
Maximum number of zones displayed? ~5 per side (support + resistance), automatically removing old zones for new ones.
Do zones repaint? Pivots need confirmation, so zones appear ~20 bars after the pivot. Once drawn, no repaint.
Green box looks faint, hard to see? Intentionally faint so as not to obscure price action. If hard to see, zoom in or change TradingView theme.
Do zones work on crypto / forex / stocks? Yes, on any asset with real volume. Forex spot has no real volume (only tick volume) → zones are drawn but lower quality. Crypto futures and stocks = highest quality.
Are there breakout alerts for zones? No dedicated alerts. However Pullback Signals often fire near zones → Pullback alerts already "cover" them. See Alerts.
Final thought
Enter inside the zone, not at the edge. SL outside the zone, not inside.
S/R Volume Zones are the structural anchors every trader needs. Without them, stops are guesses and TPs are wishes. With them, the trade plan writes itself.
Where to go next
- The core entry engine the zones anchor: Pullback Signals.
- The Hidden Divergence dots that combine with zones for A+++ setups: Hidden Divergence.
- The structural-levels companion study: mrD-Smart Ranges.
- The 12 golden rules for max win rate: Winrate Tips.
- Back to the study overview: mrD-RSI Pullback.