Waves Trend Signals
Waves Trend Signals is the default-on entry engine inside mrD-Signals Premium — selective trend-following that only prints a STRONG BUY / STRONG SELL triangle when multiple confirmation filters agree at the same time. Full settings reference, profile-by-timeframe recommendations, and the canonical pre-trade checklist.
Waves Trend Signals is the default-on entry engine inside mrD-Signals Premium. It catches the start of a new trend wave and rides it until exhaustion — unlike Contrarian (which targets reversal points), Waves Trend is selective trend-following that only fires when several confirmation layers agree on the same bar.
This page is the settings reference. For the larger context on how this module sits inside the study, start at the overview.
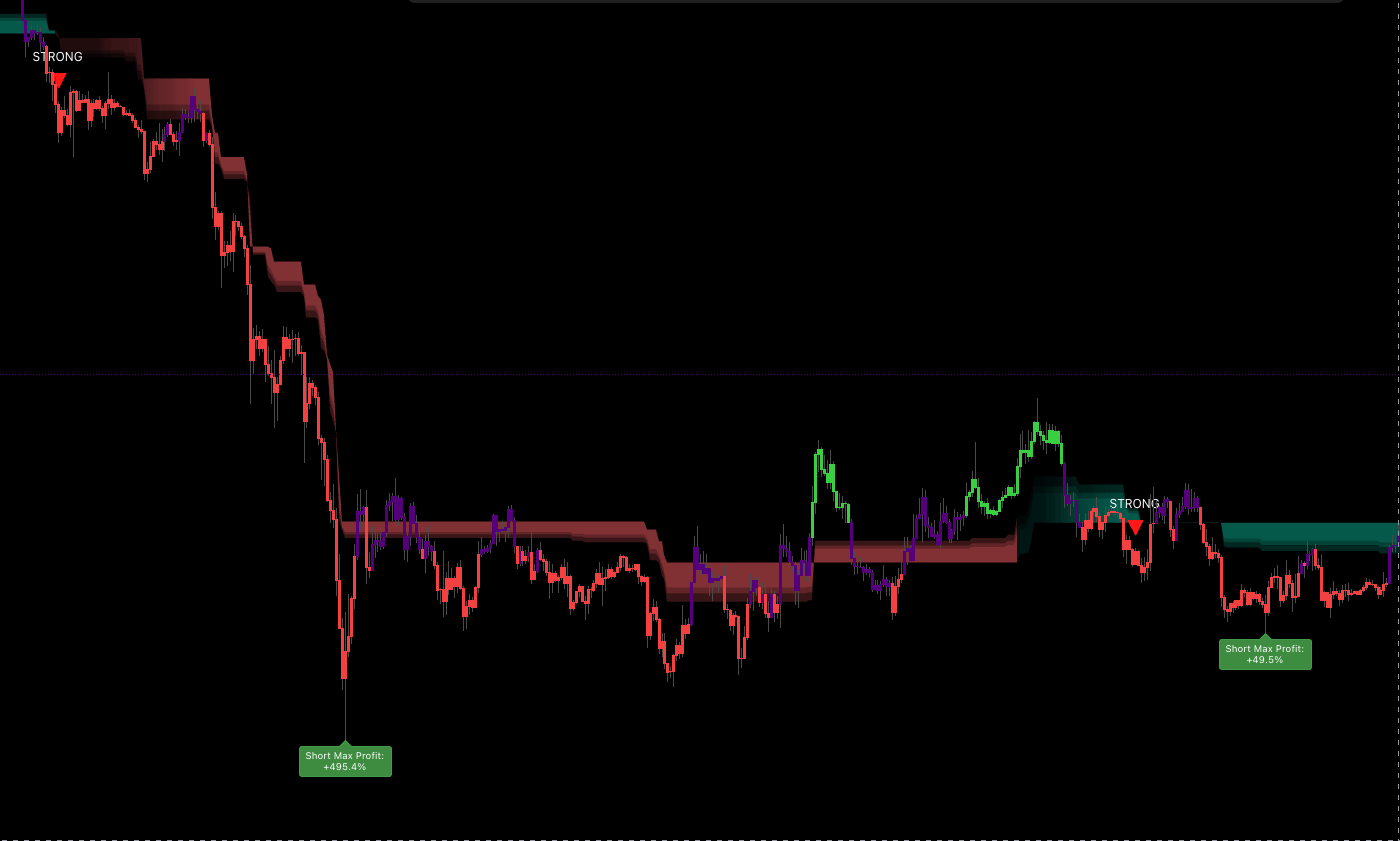
 Triangle entries with the bar-coloring layer underneath. Triangle = entry trigger; bar colour = regime context.
What this module does
A signal triangle prints when the engine confirms all of the following on the same bar:
- Short and medium-term trend agreement — both internal trend filters point the same way.
- Signal clarity above the noise floor — the proprietary DSP metric (universal scale across assets) confirms the move is real, not a one-bar spike.
- Volume confirmation — relative volume confirms buyers / sellers actually pushed the bar; without it the triangle is suppressed.
- Anti-sideways and anti-counter-trend guards — the engine refuses to print during chop or against an established regime.
Triangles ship in two labelled tiers — STRONG BUY (green triangle pointing up) and STRONG SELL (red triangle pointing down). There is no NORMAL tier for Waves Trend; the multi-filter agreement is the strength bar by design.
 A clean entry: signal triangle, matching bar colour, fresh trend wave. The combination is what makes Waves Trend a "selective" engine — most candles do not satisfy every filter at once.
Bar coloring — the fast trend filter
Alongside the triangles, every bar gets coloured by the same trend logic that produces the triangles:
- Green bar — price is on the right side of a short-term up trend.
- Red bar — price is on the right side of a short-term down trend.
- Neutral bar — no clear trend on the short-term filter → stay out.
The bar colour is your regime context between discrete signal triangles. The triangle is the entry trigger; the colour is the running answer to "is the regime still in my favour?".
Profile selector
The Signals Swing dropdown tunes how strict or loose the engine is. Same triangle definition, very different responsiveness.
| Profile | Reaction | Best for |
|---|---|---|
Short-Term | Fast, frequent signals | Higher TF charts (≥ 1H) or quiet markets — the structure is clean enough that responsive settings catch waves earlier. |
Mid-Term (default) | Balanced | Suits most timeframes and assets. Start here. |
Long-Term | Strict, fewer signals | Lower TF charts (≤ 1H) where intraday noise demands heavier filtering. |
Auto Detect | Picks profile from chart TF | The system maps high TF → Short-Term and low TF → Long-Term. |
Auto Detect — read this carefully
The Auto-Detect mapping is counter-intuitive on first read. High TF maps to Short-Term, and low TF maps to Long-Term. The reasoning:
- High TF (1D / 1W) has less noise and clean structure → responsive settings can catch waves quickly without being fooled.
- Low TF (1m / 5m) has more random noise → strict settings are needed to filter the noise out before signalling.
If you skip past this and pick the "obviously matching" profile by name, you will get noisy signals on low TFs and slow signals on high TFs. Use Auto Detect unless you have a specific reason to override.
Manual rules of thumb
If you prefer to set the profile yourself:
- Scalping / day-trading (1m–15m chart) →
Long-Termto kill intraday noise. - Swing trading (1H–4H chart) →
Mid-Term. - Position / macro (1D+ chart) →
Short-Termfor responsiveness.
Why you should pair this module with Trend Cloud
Waves Trend tells you when to enter. Trend Cloud tells you whether the trend is still valid and where to anchor stops. The two modules are designed to run together.
What the cloud says about a printed triangle:
| Trend Cloud state | STRONG BUY ▲ means... | STRONG SELL ▼ means... |
|---|---|---|
| Green / uptrend | Pullback confirmed — A-grade long | Counter-trend — skip or scalp small |
| Red / downtrend | Counter-trend — skip or scalp small | Pullback confirmed — A-grade short |
| Just flipped | Wait 3–5 bars for the cloud to settle | Wait 3–5 bars for the cloud to settle |
| Dense (high accumulated volume) | Trend has conviction — enter confidently | Trend has conviction — enter confidently |
| Thin (low accumulated volume) | Weak trend — reduce size | Weak trend — reduce size |
In short: Trend Cloud is the regime filter, Waves Trend is the entry trigger inside that regime. Disabling the cloud "to see signals better" is the most common cause of avoidable losing trades.
Recommended baseline setup
A baseline you can flip on for any new chart and trust to read sensibly:
- Enable Trend Cloud as an overlay.
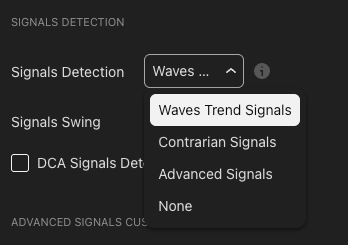
- Set Signals Detection to
Waves Trend Signals. - Set Signals Swing to
Auto Detect time-frameto start; override manually only if signal count looks obviously wrong. - Optional — enable DCA Signals Detection for secondary entry dots at intermediate pullbacks.
- Optional — enable Trail Cloud for a dynamic trailing-stop reference.
Pre-trade checklist
Before clicking enter on any printed triangle, walk this list:
- Trend Cloud colour matches the triangle direction.
- Cloud has held the same colour for at least 5 bars (no fresh flip).
- Cloud is reasonably dense — not paper-thin.
- Bar colour matches the triangle (green bar with ▲, red bar with ▼).
- Triangle appears not too far from current price (otherwise consider a limit entry near the cloud's base line).
Five out of five = A+. Four = A. Three = B (half size). Two or below = skip.
Trading playbook
The patterns below are starting templates, not prescriptions — adapt to your own risk model.
Long — STRONG BUY ▲ inside a green Trend Cloud
| Step | Action |
|---|---|
| Entry | Market on the signal bar's close, or a limit at the cloud's base line — whichever fills first. |
| Stop | A few ticks below the cloud's base line. If broken, the regime has flipped — exit. |
| TP 1 (1/3) | Nearest swing high, or the middle band of the cloud. |
| TP 2 (1/3) | Trail along the dense core of the cloud. Exit if price closes below the core. |
| TP 3 (1/3) | Trail the base line until an opposite STRONG SELL ▼ prints or the cloud flips red with bar confirmation. |
Short — STRONG SELL ▼ inside a red Trend Cloud
Symmetrical to the long playbook. Stops sit just above the base line; trails follow the base line down; exit on an opposite STRONG BUY ▲ or a confirmed cloud flip.
Position sizing by checklist rating
- A+ / A → full size.
- B → half size.
- Counter-trend (triangle against cloud) → 0 size, do not enter.
Tips to improve signal quality
Wait for the pullback to the base line
The strongest setup is when price pulls back to or near the Trend Cloud's base line before the triangle prints. You enter at the trend's demand zone (long) or supply zone (short) with the best R:R. If price is already extended from the base line when the triangle fires, place a limit at the base line and let the pullback come to you.
Read the signal-clarity meter
The same triangle is not always equal-strength. Read the clarity indicator (where exposed by your setup):
- Weak / sideways — not a real trend, skip.
- Moderate — half size.
- Strong — full size, can use leverage.
- Very strong — clear trend, but possibly near an extreme — be careful with size and consider partial exits earlier.
Cross-check higher-timeframe agreement
For a 15m entry, glance at 1H and 4H trend-cloud colour:
| 15m signal | 1H cloud | 4H cloud | Decision |
|---|---|---|---|
| ▲ BUY | Green | Green | A+ — full size |
| ▲ BUY | Green | Red | B — half size |
| ▲ BUY | Red | Red | Skip |
| ▼ SELL | Red | Red | A+ — full size |
| ▼ SELL | Red | Green | B — half size |
| ▼ SELL | Green | Green | Skip |
Avoid the first triangle after a fresh cloud flip
The very first triangle right after the cloud flips colour has a lower base rate than later triangles — the system is still confirming the new regime. Two safer alternatives:
- Wait for the second or third triangle after the flip, or
- Wait five bars with the cloud still holding the new colour before taking the first triangle.
Switch profile by volatility regime
| Situation | Action |
|---|---|
| Quiet, ranging market | Step the profile down (Mid → Short-Term) to catch tighter waves. |
| Volatile, trending market | Step the profile up (Mid → Long-Term) to filter the fakeouts. |
| News day / earnings | Switch to Long-Term and wait for a confirmed pullback. |
| Crypto weekend | Either Long-Term or disable the module. |
DCA Signals as a secondary entry
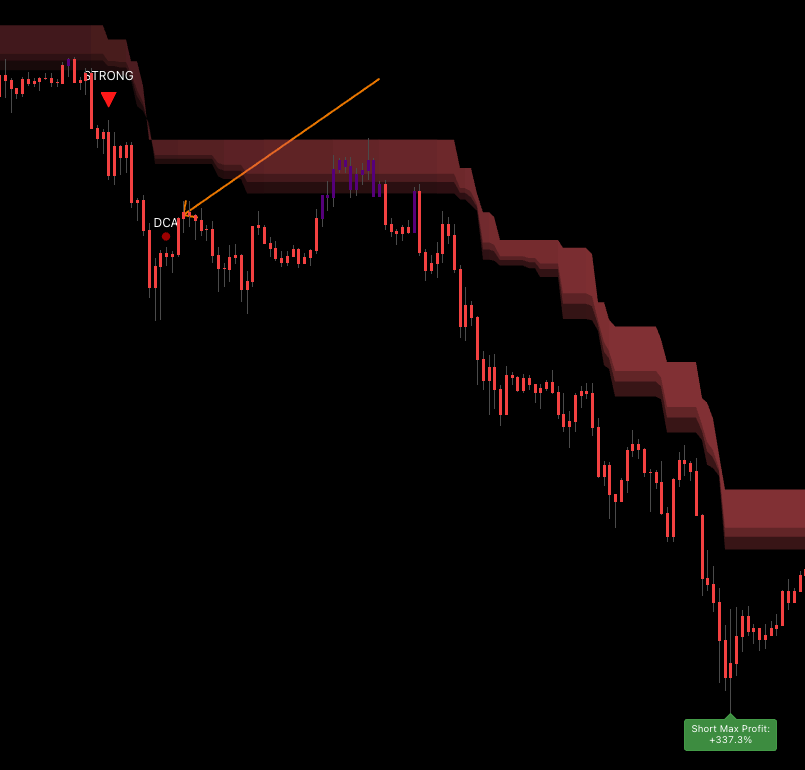 DCA dots fire at intermediate pullbacks. A 1H STRONG BUY ▲ followed by a 15m green DCA dot a few bars later is a double-confluence read.
Enable DCA Signals Detection to surface small green / red dots at intermediate pullbacks. The strongest read is when a 1H STRONG BUY ▲ is followed by a 15m green DCA dot within a few bars — both timeframes agree on the same pullback.
Common mistakes
- Entering against the cloud colour. The single largest source of avoidable losing trades. Confirm regime first.
- Ignoring neutral bars. A neutral bar means the short-term trend filter is undecided — sit out, do not force.
- Stop placed too tight. Waves Trend fires after confirmation, so the next bar can range wide. Place the stop below the cloud's base line, not at the signal bar's low.
- Wrong profile for the timeframe.
Long-Termon 1D = almost no signals.Short-Termon 1m = chaos. - Disabling Trend Cloud "to see signals better". You just removed the most important filter.
- Trading when signal clarity is low. That is the noise zone, not a trend.
- Forgetting to check volume confirmation. Volume opposite to signal direction is a major red flag — the bar likely will not follow through.
Where to go next
- Trend Cloud — the regime filter that pairs with this module by design.
- Trail Cloud — dynamic trailing-stop zone for the playbook exits above.
- Statistics Dashboard — read the historical win rate of Waves Trend on the current symbol before committing size.
- Alerts — fire push / webhook on every STRONG BUY / STRONG SELL.
- Contrarian Signals — the reverse-side companion when you want to fade extremes.