Key Level
Key Level is the supply / demand map inside mrD-Signals Premium — coloured boxes drawn at significant pivots that auto-flip polarity when broken, plus a one-shot ▲ Breakout / ▼ Breakdown triangle when every overhead or support box on one side flips. Volume label per box exposes the conviction behind each level.
Key Level is the supply / demand map of the chart — the places where price has previously turned and where buyers vs sellers had real "trouble". The module draws coloured boxes at significant highs and lows and tracks them live as they get tested, broken, and flipped in polarity.
Where the trend overlays tell you which way the market is going, Key Level tells you where it has to go through to get there. Every trade decision should be checked against the boxes before acting.
 Boxes drawn automatically at significant pivots. Each box has a 3D depth gradient and a volume label on the right edge.
What this module does
- Detects pivot zones and draws a coloured box per zone.
- Polarity flips automatically — a broken red box becomes a green box (and vice versa) at the moment of the break. Boxes do not vanish; they keep living in the new role.
- Tracks per-box volume in real time and prints a volume label on the right edge.
- Prints a one-shot ▲ Breakout triangle when every overhead red box has flipped to green and price is at a fresh high.
- Prints a one-shot ▼ Breakdown triangle when every support green box has flipped to red and price is at a fresh low.
Five pieces of information per box
| Element | What it tells you |
|---|---|
| Box colour | Current role — green = demand (buy zone), red = supply (sell zone). |
| Box position | Top (HH / HL) or bottom (LH / LL) — drives stop and target placement. |
| How long the box has held | The longer unflipped, the more meaningful; just-flipped = not yet retested. |
| 3D depth | Dense core = heart of the zone, faded edge = tolerance band. |
| Volume label | Actual volume traded inside the zone while price was aligned with the zone's polarity — the higher the number, the more important the level. |
Each box uses a three-layer visual for instant reading: outer faded edge (full price range), dense inner core (heart of the zone), and a dotted spine line through the middle (useful reference for limit orders or partial TPs).
Triangles fire once when structure flips
The ▲ Breakout and ▼ Breakdown triangles are edge-triggered — they print only on the exact bar where every Key Level box has just flipped to the same side. They do not repeat on subsequent bars, even if price keeps making new highs / lows. Every triangle is a real structural event worth acting on.
Reading Key Level in 30 seconds
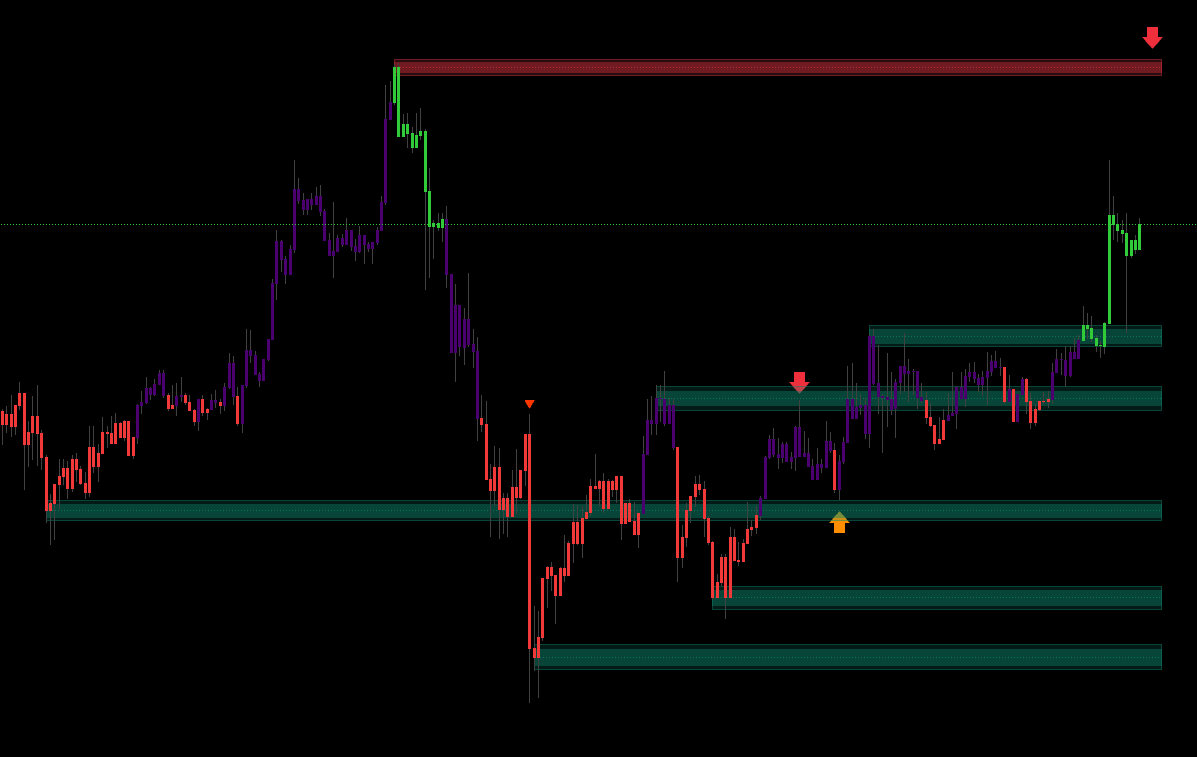 Four canonical events: first tap, bounce, close-through (polarity flip), and the one-shot Breakout / Breakdown triangle.
| Event | How to read | Action |
|---|---|---|
| Price first taps a box | Testing the supply / demand zone | Watch the reaction — rejection candle? |
| Price bounces off the box | Zone still valid | Possibly trade the bounce in the zone's direction. |
| Price closes through the box | Zone broken — polarity flips | Wait for retest; if it holds, trade in the break direction. |
| ▲ Breakout triangle | All overhead zones flipped + price at high (one-shot) | Strong buy — fresh bull leg. |
| ▼ Breakdown triangle | All support zones flipped + price at low (one-shot) | Strong sell — fresh bear leg. |
The Polarity Flip rule
This is the core concept of Key Level and one of the strongest edges in price action:
A resistance zone (red), once broken upward, often becomes a support zone (green). And vice versa: a support zone, once broken down, often becomes resistance.
The module handles this automatically — you see the box change colour at the moment of the break. The practical consequence is the classic Break and Retest setup:
- Price breaks up through a red box → red box becomes green.
- Price pulls back to that exact new green box.
- Bounces → highest-quality entry for the continuation move.
Key Level gives you the exact retest zone instead of forcing you to draw it by hand.
When is a breakout meaningful?
A ▲ Breakout triangle is strong when:
- All overhead boxes have already turned green (price has broken through multiple resistance zones in sequence).
- Price is at the highest level in the lookback (so it is not a fake breakout inside a range).
- It is the first bar that satisfies both conditions — the triangle prints once and does not repeat.
The module performs all three checks before printing, so the triangle is fairly trustworthy — but still combine it with Trail Cloud / Trend Cloud for the regime confirmation.
Key Level in the broader study
Key Level is the structural framework — not a bias filter like the trend clouds, but the topographical map. Every entry and exit should pass through it.
Combining with the trend clouds
| Trend cloud | Key Level event | Decision |
|---|---|---|
| Green cloud | Price pulls back into a green box | A+ long — precise entry. |
| Green cloud | Price breaks an overhead red box (▲ Breakout) | A+ long — continuation breakout. |
| Green cloud | Price stuck between red boxes | B — inside a range, scalp small. |
| Red cloud | Price pulls back into a red box | A+ short. |
| Red cloud | Price breaks a support green box (▼ Breakdown) | A+ short — bear continuation. |
| Green cloud + ▼ Breakdown | Major warning — possible trend reversal | Stand aside until clarity. |
Combining with signal modules
| Signal module | How Key Level is used |
|---|---|
| Waves Trend | Triangle prints at a Key Level box (same direction) → A+. |
| Contrarian | Strongest when the Contrarian triangle appears at the edge of a box — a reversal with structural reason. |
| Advanced | Strongest confluence when signal + Key Level + trend cloud all agree. |
Smart stop-loss placement
This is the most valuable use of Key Level: stop-loss on the far side of the box.
- LONG entry at a green box → stop a few ticks below the bottom of the green box (not below the entry candle).
- SHORT entry at a red box → stop a few ticks above the top of the red box.
If price runs all the way through the entire demand / supply zone, the original reason for the trade has failed — exit. Stops at the candle low / high are too tight and get swept by intraday noise.
Recommended setup
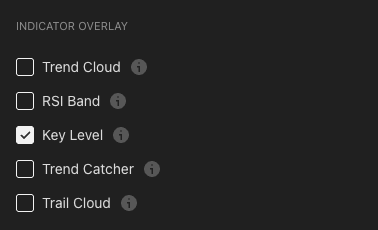
- Enable Key Level in the indicator-overlay panel.
- Enable Trend Cloud or Trail Cloud as the bias filter.
- Keep volume tracking enabled so you read the per-box volume labels.
- Optional — pick a signal mode per your strategy.
Pre-trade checklist
- A same-direction box exists in the current price area (green for long, red for short).
- The trend cloud agrees with the box.
- Clear candle reaction at the box edge (rejection / engulf / pin).
- Box is fresh (not heavily retested already).
- Distance from entry to the far edge of the box is wide enough for a reasonable stop.
5/5 → A+ full size. 4/5 → A full size. 3/5 → B half size. 2 or fewer → skip.
Trading playbook
Long setup 1 — bounce off a demand zone (green box)
| Step | Action |
|---|---|
| Wait | Trend cloud green + price pulls back to a green box below. |
| Trigger | Bullish rejection candle right at the top edge or middle of the box. |
| Entry | Market on confirmation candle, or limit at the box's top edge. |
| Stop | A few ticks below the bottom of the green box. Box lost → setup invalidated. |
| TP 1 (1/3) | Halfway to the next overhead red box, or nearest swing high. |
| TP 2 (1/3) | The bottom edge of the next red box (next resistance). |
| TP 3 (1/3) | Trail with the trend cloud until it flips red. |
Long setup 2 — Breakout (▲) + retest
When a ▲ Breakout triangle fires, wait for price to pull back to the just-flipped red-to-green box, take the bullish trigger candle at the new green box, stop below the bottom, trail with the trend cloud. The retest entry has much better R:R than chasing the breakout itself.
Short — symmetrical
Bounce off a red box inside a red cloud, or ▼ Breakdown + retest of the just-flipped green-to-red box.
Sizing by confluence
| Confluence | Size |
|---|---|
| Box + trend cloud + signal all agree | 100% |
| Box + trend cloud (no signal) | 75% |
| Box + signal only (cloud neutral) | 50% |
| Box against trend cloud | 25% or skip |
Tips to improve outcomes
Stacked boxes = very strong zone
When you see multiple same-colour boxes clustered close together (e.g. two or three green boxes overlapping at a support area), that is a very strong demand zone. Price rarely breaks straight through it; if it does, the bear move that follows is usually deep.
Use as a high-confidence bounce entry, or as a robust stop anchor if you are already short.
Fresh boxes usually outperform old boxes
A freshly formed box (within recent dozens of bars) is usually more respected than an old box that has been tested many times. The third or fourth test of a zone is often the test that breaks it. Prefer trading fresh boxes; on heavily-tested boxes, prepare for the breakout rather than betting on the bounce.
Volume label — reading hidden conviction
Every box prints a volume number on its right edge — total volume traded inside the box while price was aligned with the zone's polarity. In other words, the conviction that the "right-side" players actually put in.
- High label + green box = very strong demand → prefer long entries here.
- Low label + green box = weak demand → reduce size or skip.
- When a box flips polarity, the volume resets and starts counting for the new role.
Compare volume labels across same-colour boxes to find which one carries the most conviction.
False break = silent reversal
When price spikes past a box and immediately closes back inside (long wick + body returning into the box) without any Breakout / Breakdown triangle printing, that is almost certainly a stop-hunt trap. Action:
- Wait for a confirmation reversal candle (opposite-direction close).
- Enter against the false break (long after a bear-trap, short after a bull-trap).
- Stop just outside the spike wick (not outside the whole box — too wide).
- TP toward the opposite-colour box on the other side or further.
If a box is breached but does not flip colour within one or two bars, that breach was fake.
Multi-timeframe Key Level
Higher-TF Key Levels are far more important than lower-TF ones:
- 1D Key Level → macro structural zone → stops should be outside the 1D box.
- 4H Key Level → main swing-trade zone.
- 1H Key Level → intraday entry zone.
- 15m Key Level → micro structure for scalps.
Trade rule: enter on the lower TF, target on the higher TF. Example — spot a green 4H box, drop to 15m, enter at a 15m green box overlapping the 4H zone.
When to ignore Key Level
In extremely trending sessions (large gap up / down, or a big news event), price can slice straight through every box without respect. Don't try to fade bounces in that regime — you will get steamrolled. Trade with momentum and use the trend cloud as your filter. Wait for the session to settle; the new boxes that form afterwards regain their value.
Common mistakes
- Bouncing against the trend cloud. "Green box = long" is not always true. If the trend cloud is red, that green box is more likely to break than to hold.
- Stop too tight at the box edge. The edge is a battle zone; noise will sweep your stop. Place it a small ATR away from the edge.
- Guessing "maybe it'll still break out". When no Breakout / Breakdown triangle appears after a breach, do not anticipate; wait for the actual flip.
- Trading every individual box inside a range. In sideways markets most boxes look important; most are not. Require confluence (cloud + signal + Key Level).
- Counting boxes manually for LONG vs SHORT. The module already verifies "all zones on that side broken" before printing the triangle — do not override on intuition.
- Disabling Key Level for a clean chart. You just removed your structural map. If the chart feels busy, disable Trend Cloud first; keep Key Level on.
Common questions
Q. I am getting too many / too few boxes. A box prints at every meaningful pivot. Lower TFs (1m / 5m) will naturally have many boxes; higher TFs (1D / 1W) will have fewer but each is far more important. That is expected — do not try to "tune sensitivity".
Q. When do boxes disappear? When price clearly breaks through a box and closes on the other side, the box flips colour in place — it does not vanish; it keeps living in its new role. When new boxes form and the total exceeds the display limit, the oldest box is automatically cleaned up.
Q. What does the 3D depth mean for entries? The dense core is the heart of the zone. When price retests, the strongest reaction happens around the core. For limit orders, placing them near the spine line or the inner edge of the core typically yields better fills than placing them at the outer edge.
Q. Does Key Level work in sideways markets? Yes — actually very well. In sideways action the boxes form a clear range track: long at the lower green box, short at the upper red box, target the opposite box. One of the best setups when the market is chopping.
Where to go next
- Trend Cloud — the regime filter that confirms Key Level entries.
- Trail Cloud — the structural pairing for Key Level anchor stops.
- Trend Catcher — ▲ triangle landing on a green Key Level box = the "gold combo".
- Alerts — wire
Break Out/Break Downalerts on the one-shot triangles. - Overview — back to the study overview.