Orderbook · Depth Profile
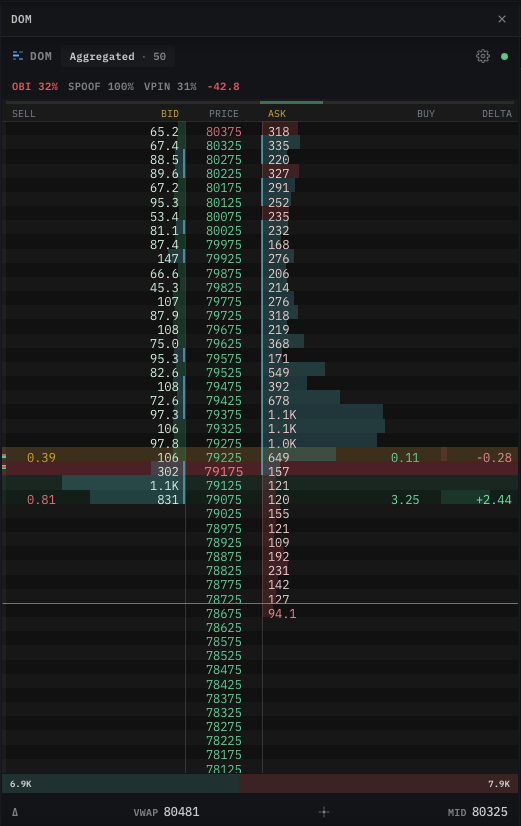
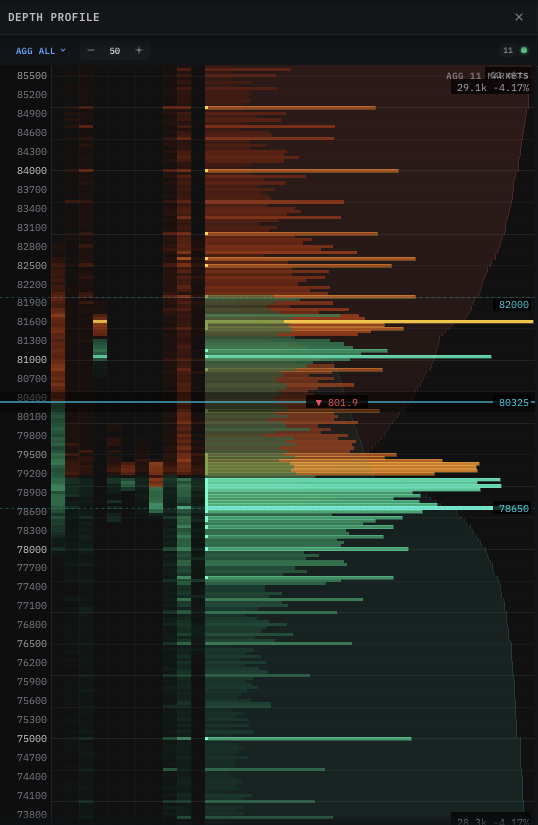
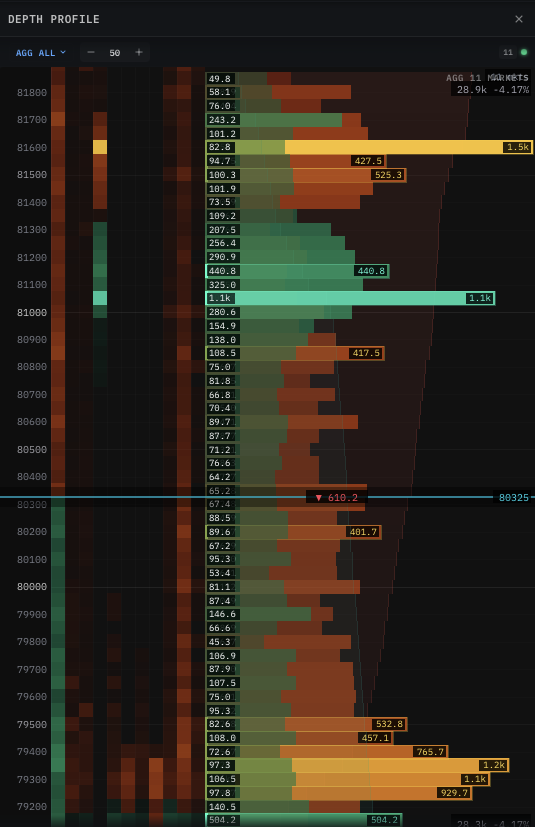
Standalone Orderbook + Depth Profile module — same engine renders two complementary views — (1) a vertical orderbook panel with signal rows (OBI, spoofing, absorption, walls, gaps) — and (2) a multi-exchange depth profile with horizontal bars per price level and labeled walls. Its own canvas, its own engine.
The Orderbook · Depth Profile is the most flexible standalone module: one engine, one canvas, two complementary rendering modes.
- Orderbook view — a vertical depth ladder, a rolling micro-heatmap column for each snapshot, plus optional order-flow signal overlays (OBI, spoofing, absorption, net flow, walls, gaps) rendered as highlight rows on the ladder.
- Depth Profile view — horizontal depth bars per price level, multi-exchange aggregation (AGG ALL or per-venue), labeled walls (e.g. "1.5k", "1.2k"), and an optional time-heatmap strip for the history of resting depth.
Both views share the same data feed and the same engine — createOrderbookBridge — and switch behaviour through public options (exchangeCount, heatmapCols, showSignalOverlays, setSignalWalls, etc.). Customers typically pick one mode based on what their trader wants to see; advanced products switch between them based on the user's panel choice.
Use this when:
- You want a full side-panel orderbook view comparable to professional desktop tools.
- Your data layer can produce order-flow signals server-side (or via a separate JS pipeline) and you want them visualised on the same canvas as the depth.
- You need a multi-exchange depth profile with aggregated or per-venue liquidity rendered on horizontal bars per price level.
- You need a single component that takes raw book snapshots and gives the user a complete order-flow read in one pane.
If you only need a focused single-exchange price ladder without aggregation or signal overlays, the lighter DOM Ladder module covers that use case with a smaller surface and lower data overhead.
The two rendering modes
The engine ships in one binary; which view you get is determined by how you configure it. Both modes are documented in detail below.
Orderbook view (single-venue, order-flow signals)
pushSnapshot and the setSignal* setters.Configuration profile (mount with these options):
| Option | Value | Effect |
|---|---|---|
exchangeCount | 0 or 1 | Single-venue book, no multi-exchange columns. |
heatmapCols | 5-10 | Few rolling micro-heatmap columns next to the ladder. |
showSignalOverlays | true | Enables OBI / SPOOF / absorption / walls / gaps overlays. |
Depth Profile view (multi-exchange, horizontal liquidity bars)
Configuration profile (mount with these options):
| Option | Value | Effect |
|---|---|---|
exchangeCount | 2-N | Aggregate (or display per-venue) depth across multiple exchanges. |
heatmapCols | 20-100 | Wide history strip shows how depth evolves through time. |
showCumulative | true | Horizontal bars expand to total resting depth per price row. |
showSignalOverlays | false | Hide order-flow signal rows — focus the user on liquidity. |
Same engine, same data. Switching between the two views is just
setExchangeCount(n)+setHeatmapCols(n)+setShowSignalOverlays(b). You can expose this as a "View mode" toggle in your UI without re-mounting the canvas.
Install & import
import { createOrderbookBridge } from '@mrd/chart-engine'
Attach to a canvas
The panel needs its own <canvas> — never share with the main chart or with another standalone module.
<div class="ob-wrap" style="width: 360px; height: 720px;">
  <canvas ref="obCanvas" style="width: 100%; height: 100%;"></canvas>
</div>
Sizing rule. The canvas relies on width: 100%; height: 100%; the parent provides the actual pixel size. A zero-height parent is the #1 cause of "mounted but doesn't render". The panel is taller than it is wide — a ratio of roughly 1 : 2 (e.g. 360 × 720) works well at desktop sizes.
Mount
const ob = await createOrderbookBridge(canvas, {
  symbol: 'BTCUSDT',
  tickSize: 0.5,
  visibleTicks: 40,
  heatmapCols: 60,
  exchangeCount: 1,
  pricePrecision: 2,
  theme: 'dark',
})

ob.start()
Options
| Option | Type | Default | Description |
|---|---|---|---|
symbol | string | — | Optional label used in the header. |
tickSize | number | 0.25 | Price increment between ladder rows. |
visibleTicks | number | 40 | Number of price rows in the ladder. |
heatmapCols | number | 5 | Number of trailing depth-snapshot columns rendered alongside the ladder. |
exchangeCount | number | 0 | Number of separate exchange columns when aggregating multi-exchange depth. 0 means single-exchange. |
pricePrecision | number | 2 | Decimals shown on the price column. |
theme | 'dark' | 'light' | 'dark' | Initial theme. |
ringCols | number | 300 | Internal ring-buffer capacity for the heatmap columns (advanced). |
ringRows | number | 400 | Internal ring-buffer capacity for ladder rows (advanced). |
Push data
Three primary data paths feed the panel. Pick the one that matches your data source.
ob.pushSnapshot(bids, asks, midPrice)
Push one full orderbook snapshot that both renders into the ladder and appends as a new heatmap column. This is the most common path — call it once per depth update from your data source.
| Argument | Shape | Description |
|---|---|---|
bids | Array<[price, qty]> | Best bid first. |
asks | Array<[price, qty]> | Best ask first. |
midPrice | number | Current mid (drives ladder centering). |
ws.on('depth:snapshot', (s) => {
  ob.pushSnapshot(s.bids, s.asks, s.mid)
})
ob.pushSnapshotFlat(bidFlat, askFlat, midPrice)
Same intent as pushSnapshot, but takes pre-flattened typed arrays — skips an allocation step in the hot 5-10 Hz loop. Recommended when you control the buffer life-cycle.
const bidBuf = new Float64Array(40 * 2)
const askBuf = new Float64Array(40 * 2)
ws.on('depth:snapshot', (s) => {
  for (let i = 0; i < s.bids.length; i++) {
    bidBuf[i * 2]     = s.bids[i][0]
    bidBuf[i * 2 + 1] = s.bids[i][1]
  }
  // ... same for asks
  ob.pushSnapshotFlat(bidBuf, askBuf, s.mid)
})
ob.setDepthBook(bids, asks, midPrice) / ob.setDepthBookFlat(...)
Same shape as pushSnapshot but only updates the ladder — does not append a heatmap column. Use when your heatmap data has a different cadence from your depth feed (e.g. ladder updates at 10 Hz, heatmap rolls forward only once per second).
ob.pushHeatmapCol(bids, asks, midPrice) / ob.pushHeatmapColFlat(...)
The complement to setDepthBook — appends a heatmap column without touching the ladder. Useful when:
- You aggregate depth differently between the ladder display and the historical heatmap.
- You want to advance the heatmap on a wall-clock tick independent of book activity.
ob.resetRing()
Wipe the heatmap ring buffer. Call on symbol change so old columns don't bleed into the new symbol's view.
Multi-exchange Depth Profile
The Depth Profile view aggregates resting liquidity across multiple exchanges into one panel. There are two patterns — pick the one your data layer supports.
Pattern A — server-merged book (recommended)
If your backend can merge depth across N venues and emit a single combined order book, treat it like a normal pushSnapshot — the engine doesn't need to know how many exchanges fed into it.
const ob = await createOrderbookBridge(canvas, {
  symbol: 'BTCUSDT',
  tickSize: 50,        // wider aggregation → reads as "AGG 50" in the header
  visibleTicks: 60,
  heatmapCols: 80,     // wide history strip
  exchangeCount: 0,    // engine sees one merged book — don't split into columns
  showSignalOverlays: false,
})

ws.on('depth:merged', (s) => {
  ob.pushSnapshot(s.bids, s.asks, s.mid)
})
Server-merging gives you exact volume conservation and avoids the JS-side allocation cost of summing maps every tick. This is how the production product renders the AGG ALL mode.
Pattern B — client-merged book
When the backend ships one stream per venue, merge in JS before pushing.
const books = new Map()   // exchange → { bids: Map<price, qty>, asks: Map<price, qty> }

function merge() {
  const bidMap = new Map()
  const askMap = new Map()
  let mid = 0, count = 0
  for (const b of books.values()) {
    for (const [p, q] of b.bids) bidMap.set(p, (bidMap.get(p) || 0) + q)
    for (const [p, q] of b.asks) askMap.set(p, (askMap.get(p) || 0) + q)
    if (b.mid) { mid += b.mid; count++ }
  }
  const bids = [...bidMap].sort((a, b) => b[0] - a[0])
  const asks = [...askMap].sort((a, b) => a[0] - b[0])
  return { bids, asks, mid: count ? mid / count : 0 }
}

ws.on('depth:per-venue', (msg) => {
  books.set(msg.exchange, msg.book)
  const merged = merge()
  ob.pushSnapshot(merged.bids, merged.asks, merged.mid)
})
For 3-5 exchanges this stays well within 5-10 Hz budget. Beyond that, push the merge to the backend (Pattern A) to avoid main-thread allocation pressure.
Per-venue columns
If you want each exchange rendered as a separate column (instead of aggregating into one merged view), set exchangeCount and label them:
ob.setExchangeCount(3)
ob.setExchangeLabels(['BINANCE', 'BYBIT', 'OKX'])
// then push each venue's book through pushSnapshot in turn
The engine slots each new pushSnapshot into the next column position internally — your code stays the same; only the canvas layout changes.
Walls labels
Labeled wall sizes (e.g. "1.5k", "1.2k") visible in the screenshot are produced by setSignalWalls — push the list of [price, size] pairs from your wall detector and the engine renders both the highlight and the size label.
ws.on('walls:update', (w) => {
  ob.setSignalWalls(w.bids, w.asks)  // [[price, size], ...]
})
Detection (which orders count as walls) happens server-side — the engine just renders the list you give it.
Signal overlays
These are optional. The panel renders them as small overlays on the ladder if you push the data; if you don't, the panel is just a clean ladder + heatmap.
All signal setters are independent — push only the ones your data layer provides.
| Method | Description |
|---|---|
ob.setSignalObi(obi, bidPrice, askPrice) | Orderbook Imbalance — a normalised -1..+1 score plus the best bid/ask prices it was computed on. |
ob.setSignalSpoof(score) | Spoofing detector score (0..1). Higher = more suspicious. |
ob.setSignalAbsorption(bidAbs, askAbs) | Absorption strength on each side. |
ob.setSignalFlow(netFlow, cumDelta) | Net order flow + cumulative delta over a recent window. |
ob.setSignalWalls(bidWalls, askWalls) | Arrays of [price, size] walls to highlight on the ladder. |
ob.setSignalGaps(bidGaps, askGaps) | Arrays of price ranges with no resting liquidity (potential fast-fill zones). |
ob.setShowSignalOverlays(show) | Master toggle to hide / show all signal overlays at once. |
// Hook the panel up to a server-side analyzer
ws.on('orderflow', (a) => {
  ob.setSignalObi(a.obi, a.bestBid, a.bestAsk)
  ob.setSignalSpoof(a.spoofScore)
  ob.setSignalAbsorption(a.bidAbs, a.askAbs)
  ob.setSignalFlow(a.netFlow, a.cumDelta)
  ob.setSignalWalls(a.bidWalls, a.askWalls)
})
ob.setExchangeLabels(labels)
When exchangeCount > 0, pass an array of short exchange labels (['BINANCE', 'BYBIT', 'OKX']) and the panel renders them as column headers above the heatmap.
Display controls
| Method | Effect |
|---|---|
ob.setSymbol(s) | Header label. |
ob.setTickSize(t) | Row spacing. |
ob.setVisibleTicks(n) | Ladder height in rows. |
ob.setExchangeCount(n) | Number of exchange columns. |
ob.setHeatmapCols(n) | Trailing heatmap columns shown. |
ob.setHeatmapAlphaMul(mul) | Heatmap cell opacity scale (0.1-1.32). |
ob.setPrecision(d) | Decimals on the price column. |
ob.setAutoCenter(b) | When true, ladder follows the mid; when false, locks to the user's manual scroll position. |
ob.centerOnMid() | One-shot — re-centers immediately, regardless of auto-center state. |
ob.setShowCumulative(show) | Toggle the cumulative-depth bars. |
ob.setTheme('dark' | 'light') | Theme switch. |
Hover
const price = ob.getHoverPrice()  // current hovered price
const qty   = ob.getHoverQty()    // size at hovered row
const side  = ob.getHoverSide()   // 0 = none, 1 = bid, 2 = ask
Call these inside your own pointer-event handler when the cursor is over the panel — useful for populating an order ticket or a side tooltip.
Lifecycle
const ob = await createOrderbookBridge(canvas, options)

ob.start()
ob.resize()      // call on parent CSS-size changes (ResizeObserver)
ob.stop()
ob.clear()       // wipe rendered state without destroying the engine
ob.destroy()     // permanent — frees buffers + listeners
destroy() is irreversible — the panel is unusable after. Create a new one if you need to re-mount.
Common pitfalls
Heatmap columns don't roll forward.
You are calling setDepthBook (ladder-only) instead of pushSnapshot (ladder + heatmap). The two paths are deliberately separate; if you want both, call pushSnapshot.
Walls highlight disappears after every snapshot.
The signal layer is explicit — you must re-push the wall list with each new analyzer frame, OR call setSignalWalls only when the wall list actually changes. The panel does not autodetect walls from the depth feed.
Order-flow score "lags by N seconds". The signal setters render whatever you push. If your server-side analyzer batches at 1 Hz, the on-screen OBI is 1 s out of date by design. Tune your analyzer cadence, not the panel.
Switching symbol shows the previous symbol's heatmap.
You forgot to resetRing() on the symbol change. The heatmap ring is keyed by column position, not by symbol — old columns persist until they age out.
Numbers look enormous on small-cap altcoins. The panel renders qty in base coins by default. If your data feed sends notional (qty × price), the numbers will look 5-7 orders of magnitude too big. Decide upstream whether you're shipping base or notional and stick to it.
Two-canvas attempt: panel and chart on the same <canvas>.
Not supported — each engine takes ownership of the canvas's drawing surface, event listeners, and DPR transform. Allocate a dedicated <canvas> per engine.
Next
- DOM Ladder — the focused price-ladder module without the signal / heatmap-column overhead.
- Tick Stream — trade tape, VWAP, large-trade markers, book micro-heatmap.
- Orderbook Heatmap (Depth) — the depth-as-color-matrix view embedded in the main chart.