Hidden Divergence
Hidden Divergence inside mrD-RSI Pullback — a trend-continuation signal (NOT a reversal signal) that fires as small green / red dots when price makes higher-low / lower-high while RSI makes lower-low / higher-high. Full reference for the difference vs regular divergence, the A++ setup combo with Pullback Signal, eight trading tips, three real-world use cases, and the rules for when to skip a dot.
Hidden Divergence is the trend-continuation layer of mrD-RSI Pullback. Unlike regular divergence — which traders use to call reversals — Hidden Divergence does the opposite: it flags the points where the trend is about to continue after a pullback. Tiny green dots appear below the bar for bullish continuation, tiny red dots appear above the bar for bearish continuation.
This page is the complete reference for the Hidden Divergence module. The dots are NOT entry triggers on their own — they are confirmation layers that turn a regular Pullback Signal into an A++ setup. Pair them with the core entry engine for maximum effect.
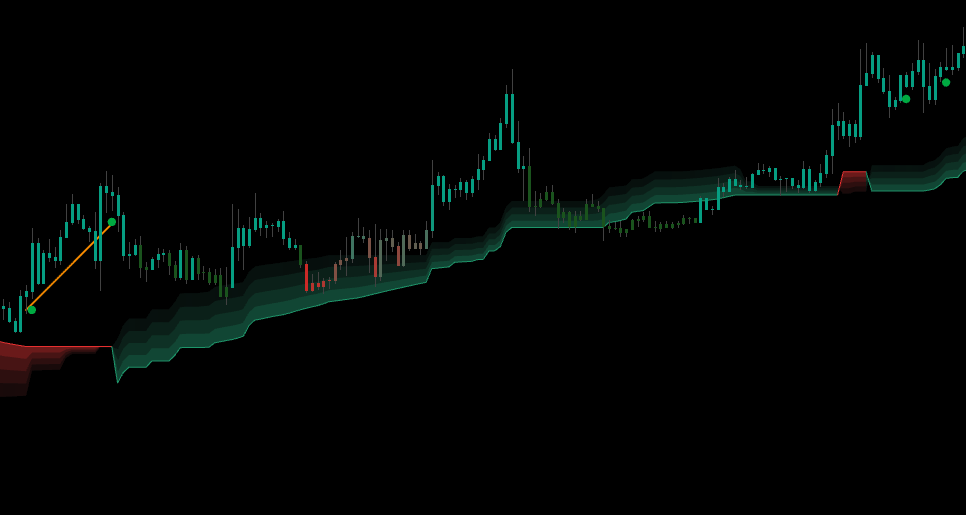 The green dot fires at the pullback low. A BUY Pullback Signal firing within 5 bars after the dot, while the cloud is stable green = A++ setup.
1. What is Hidden Divergence?
Hidden Divergence occurs when:
- Hidden Bullish Divergence: Price makes a higher low (HL), but RSI makes a lower low (LL) → uptrend continues.
- Hidden Bearish Divergence: Price makes a lower high (LH), but RSI makes a higher high (HH) → downtrend continues.
This is a misalignment between price action and momentum that signals the trend is NOT over, even when it appears to weaken.
2. Hidden vs Regular Divergence
| Type | Signal | When it appears |
|---|---|---|
| Regular Divergence | Trend reversal | Price HH / LL, RSI opposite → trend ending |
| Hidden Divergence | Trend continuation | Price HL / LH (pullback), RSI opposite → trend not over |
This indicator focuses on Hidden Divergence because it fits the pullback strategy: finding "trend-rejoin" points instead of catching tops / bottoms.
3. Enable Hidden Divergence
Open Settings → group Display → Hidden-Divergence Detect
- On — display small dots when Hidden Divergence is detected.
- Off (default) — hide.
Recommendation:
- 15m–4H+ TF — turn On (quality signal).
- 1m–5m TF — keep Off (too noisy at that resolution).
4. Reading Hidden Divergence on chart
Small green dot — below the bar
Hidden Bullish Divergence → uptrend continues.
Meaning:
- Just had a pullback (price made a higher low).
- RSI looks weak (lower low) — but it is "RSI deceiving you".
- Uptrend is intact → price will continue up.
Action:
- Combo with a firing BUY signal → enter long with confidence.
- If no signal yet, prepare and wait for the next BUY signal.
Small red dot — above the bar
Hidden Bearish Divergence → downtrend continues.
Meaning:
- Just had a bounce (price made a lower high).
- RSI looks strong (higher high) — but it is "RSI deceiving you".
- Downtrend is intact → price will continue down.
Action:
- Combo with a firing SELL signal → enter short with confidence.
- If no signal yet, prepare and wait for the next SELL signal.
5. Combo Hidden Divergence + Pullback Signal — the A++ setup
This is the highest-win-rate combination the study can produce.
A++ BUY setup
Conditions:
- Stable green cloud.
- Green Hidden Bullish Divergence dot just appeared.
- ▲ BUY signal fires within 5 bars after the green dot.
→ Full size, target R:R 1:3, SL outside the recent low.
A++ SELL setup
Conditions:
- Stable red cloud.
- Red Hidden Bearish Divergence dot just appeared.
- ▼ SELL signal fires within 5 bars after the red dot.
→ Full size, target R:R 1:3, SL outside the recent high.
The full setup-grading framework lives in Winrate Tips — setup classification.
6. Eight tips for using Hidden Divergence effectively
Tip 1 — Must have TREND CONTEXT first
Hidden Divergence is only meaningful in a trend. In sideways, it is noise.
Before paying attention to dots, check the RSI Band cloud:
- Stable green cloud ≥ 10 bars → trust green dots.
- Stable red cloud ≥ 10 bars → trust red dots.
- Choppy cloud → ignore all dots.
Tip 2 — Hidden Divergence is NOT a direct entry signal
Do not enter just because of a green / red dot. The dot is a trend-continuation warning, not an entry trigger. The trigger is still the Pullback Signal or other confluence.
Tip 3 — The closer Hidden Div is to the Pullback Signal, the better
If a green dot appears > 10 bars before a BUY signal, the meaning weakens. Ideally within 5 bars.
Tip 4 — Hidden Div on HTF is extremely valuable
Hidden Div on Daily / Weekly = extremely strong continuation signal. Can hold for months.
Strategy: open the Daily chart, see a green dot → enter long on 4H with multi-day target.
Tip 5 — Count dots in a "cluster"
If you see 2–3 green dots within 10 bars → momentum is strongly building → trend will surely run far.
Tip 6 — Combo Hidden Div + S/R Volume Zone
Green dot appearing near a Support Zone (green "S" box) → unbeatable setup:
- Pullback hit support.
- Hidden Div confirms continuation.
- Wait for BUY signal → enter.
Full S/R Zone reference: S/R Volume Zones.
Tip 7 — For swing & position trade, Hidden Div is the main weapon
Swing traders should always enable Hidden Div on 4H–D. A++ setups with Hidden Div often deliver 5–15% on crypto / 200–500 pips on forex.
Tip 8 — When to skip Hidden Div?
- When cloud is choppy → noise.
- Right after major news → fundamentals override technicals.
- After strong gaps → indicator needs closed bars to confirm.
7. Three real-world use cases
Use case 1 — Swing trading BTC 4H
- Open BTCUSDT 4H.
- Stable green cloud ≥ 30 bars (5 days).
- Just had a pullback (3–4 red bars).
- Green Hidden Bullish Divergence dot appears at pullback low.
- 2 bars later, ▲ BUY signal fires.
- → Full long size, SL below pullback low, TP target +5–10% (R:R 1:3+).
Use case 2 — Position long Gold (XAUUSD) Daily
- Open XAUUSD Daily chart.
- Long-term uptrend (thick green cloud).
- Mild pullback 5–7 red bars.
- Green dot appears at pullback low.
- Combo: green dot + green cloud + price > EMA200 + S/R Volume Support.
- → Enter long, hold weeks to months, target +10–20%.
Use case 3 — Skip Hidden Div
Situation: you see a green dot but:
- Cloud is choppy (constant flips), OR
- Cloud is red.
→ Skip entirely. A dot in the wrong context = noise.
8. Common mistakes with Hidden Divergence
| Mistake | Fix |
|---|---|
| Entering immediately on a dot | Dot is just context — wait for Pullback Signal. |
| Trusting dots in sideways | Choppy cloud → ignore dots. |
| Not checking distance between dot and signal | Old dot > 10 bars → skip. |
| Enabling Hidden Div on 1m | Too noisy — disable on small TF. |
| Trading against the dot, feeling reversal | Hidden Div trusts continuation, does not catch reversals. |
Common questions
Does Hidden Div repaint? Slightly. Because it needs to confirm pivots (local high / low), the indicator requires 3 bars after the pivot to confirm. So dots appear 3 bars later than the actual pivot. This is intentional design — ensuring no fake fires.
Can I also enable Regular Divergence? This indicator has Hidden Divergence only. Because it fits the pullback strategy. Regular Divergence (reversal signal) does not fit this purpose.
On which TF is Hidden Div most frequent? Larger TF = fewer but higher quality.
- 1m–5m: many, high noise.
- 15m–1H: moderate, good quality.
- 4H–D: few, extremely high quality.
Is Hidden Div fail rate high? Hidden Div can fail ~30–40% without trend context. But when properly combined with cloud + Pullback Signal, fail rate drops to ~15–20%.
Is there a Hidden Divergence alert? No dedicated alert. However Hidden Div usually accompanies Pullback Signals → if you have Pullback alerts, you will "cover" Hidden Div too. See Alerts.
Final thought
Green dot in green cloud + BUY signal = money-printing trade. Skip dots in choppy cloud.
Hidden Divergence is the layer that separates a B-grade swing trader from an A-grade one. Once you start filtering for "dot + signal + cloud + zone", the bad trades disappear from your account history.
Where to go next
- The core entry engine that Hidden Div confirms: Pullback Signals.
- The S/R Volume Zones that combine with Hidden Div for the best setups: S/R Volume Zones.
- The setup-classification framework with A++ / A / B / C: Winrate Tips.
- Back to the study overview: mrD-RSI Pullback.