Trend Cloud
Trend Cloud is the fast bias layer inside mrD-Signals Premium — a volume-modulated regime cloud (green up / red down) with a 3D gradient that encodes density, dynamic Fibonacci pullback zones, and a base line that acts as the trend's invalidation point. The single most useful filter to pair with any signal module.
Trend Cloud is the fast bias layer inside mrD-Signals Premium — the cloud that hugs price most closely and answers three questions at a single glance: where is the trend going, is it strong, and where is price relative to the trend's anatomy.
This is the single most useful module to combine with any of the signal engines — most "false signal" complaints with composite indicators trace back to taking signals against the prevailing regime, and the cloud is the cheapest filter to add.
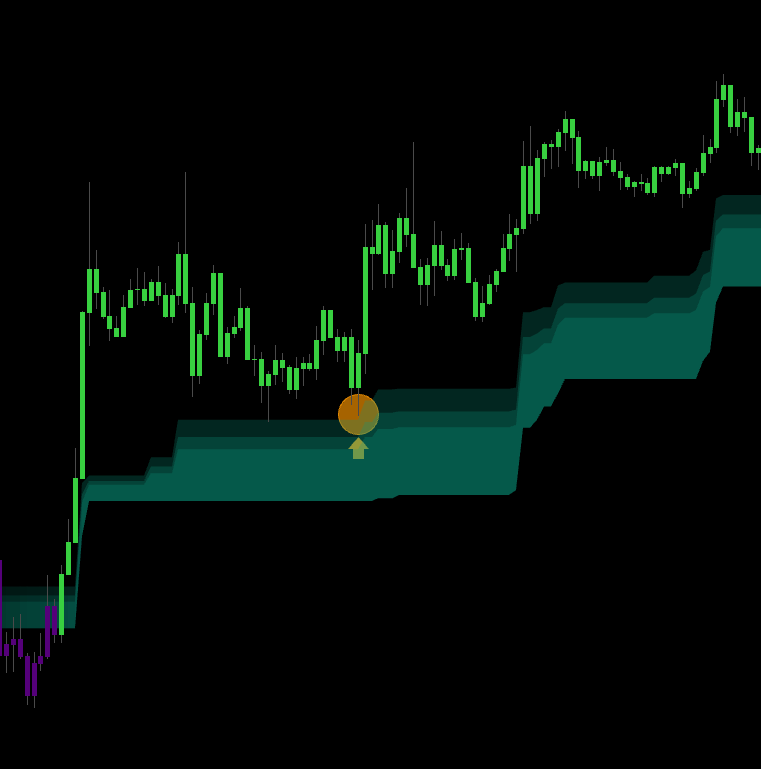
 Green cloud, dense core, price pulling back into the upper edge — a textbook in-trend entry zone.
What this module does
Trend Cloud paints a coloured regime cloud on the chart — green = uptrend, red = downtrend. The cloud is not a flat band: it has a 3D depth gradient, denser in the core and fading toward the outer edge. Each part of the cloud means something different.
Three pieces of information in one cloud
| Element | What it tells you |
|---|---|
| Cloud colour | Trend direction. Green = buy bias, red = sell bias. |
| Cloud density | Confidence level — dense = trend confirmed by volume, paper-thin = trend unconvincing. |
| Price position vs the cloud | Trend phase — far above: running strong; returning into cloud: pullback; piercing the floor: trend weakening or about to flip. |
When all three agree, you have a high-quality regime read. When they contradict, stand aside.
Why the cloud has depth
The cloud is rendered with a gradient — densest in the core, fading toward the outer edge:
- The dense interior is where the trend "takes root" — the standard pullback zone.
- The faded outer edge is the momentum frontier — where price can dance without breaking the trend.
- The cloud floor / base line is the trend's invalidation point — break it and the regime is dying.
This effect helps you read pullback phases faster: price tagging only the faded edge is a shallow pullback; price diving into the dense core is a serious pullback that warrants attention.
Reading the cloud in 30 seconds
 The cloud's anatomy: from the price-side edge inward — faded edge (momentum frontier), dense core (standard pullback zone), cloud floor (trend invalidation).
Five price positions, five actions (uptrend)
In a green uptrend cloud (cloud below price):
| Price position | State | Action |
|---|---|---|
| Price far above the cloud | Strong run, possibly extended | No new entries; wait for pullback. |
| Price tags the faded edge | Shallow pullback, trend healthy | Optionally enter with a confirming trigger. |
| Price enters the dense core | Standard pullback — demand zone | High-quality entry zone. |
| Price touches the cloud floor | Deep pullback — trend test | DCA or aggressive entry only. |
| Price breaks the cloud floor | Trend weakening / possible flip | Exit. No new entries. |
In a red downtrend cloud (cloud above price), the logic is symmetrical.
Golden rule. A pullback into the cloud is the ideal entry zone. A pullback piercing the cloud floor is the warning that the trend is dying.
Reading density — the smart volume gauge
Trend Cloud encodes volume into cloud density. There is no separate volume sub-pane to glance at.
| Density | Volume read | Meaning |
|---|---|---|
| Very dense | Strong, well accumulated | Trend has real conviction, enter confidently. |
| Medium | Normal | Trend OK, follow plan. |
| Slightly thin | Weak | Trend not confirmed; reduce size. |
| Paper-thin / transparent | Almost none | Stand aside; wait. |
Two green clouds that "look similar" can have very different quality — dense is real, thin is a trap. Train yourself to read colour AND density together.
 Multi-layer mode exposes the three internal Fibonacci levels (50% / 61.8% / 78.6%) acting as dynamic S/R within the cloud.
Trend Cloud in the broader study
Trend Cloud is the fastest bias layer. Combined with the other overlays, you get a multi-tier read:
| Layer | Speed | Use |
|---|---|---|
| Trend Cloud | Fast (≈ 5–10 bar reactivity) | The current bias filter for entries. |
| Trail Cloud | Medium (≈ 20–50 bar) | The medium-term confirmation layer. |
| RSI Band | Slow (≈ 50–200+ bar) | The macro bias layer. |
The three-colour confluence rule
The strongest setups appear when all three layers agree on direction:
| Trend Cloud | Trail Cloud | RSI Band | Signal class |
|---|---|---|---|
| Green | Green | Green | A+ long — full system alignment |
| Green | Green | Red | Short-term long inside a bear macro — half size |
| Green | Red | any | B / skip — medium term warns |
| Red | Red | Red | A+ short |
| Red | Green | any | B / skip — counter mid-trend |
| Thin / conflicting | any | any | Stand aside; market unclear |
Combining with each signal source
| Signal module | How Trend Cloud is used |
|---|---|
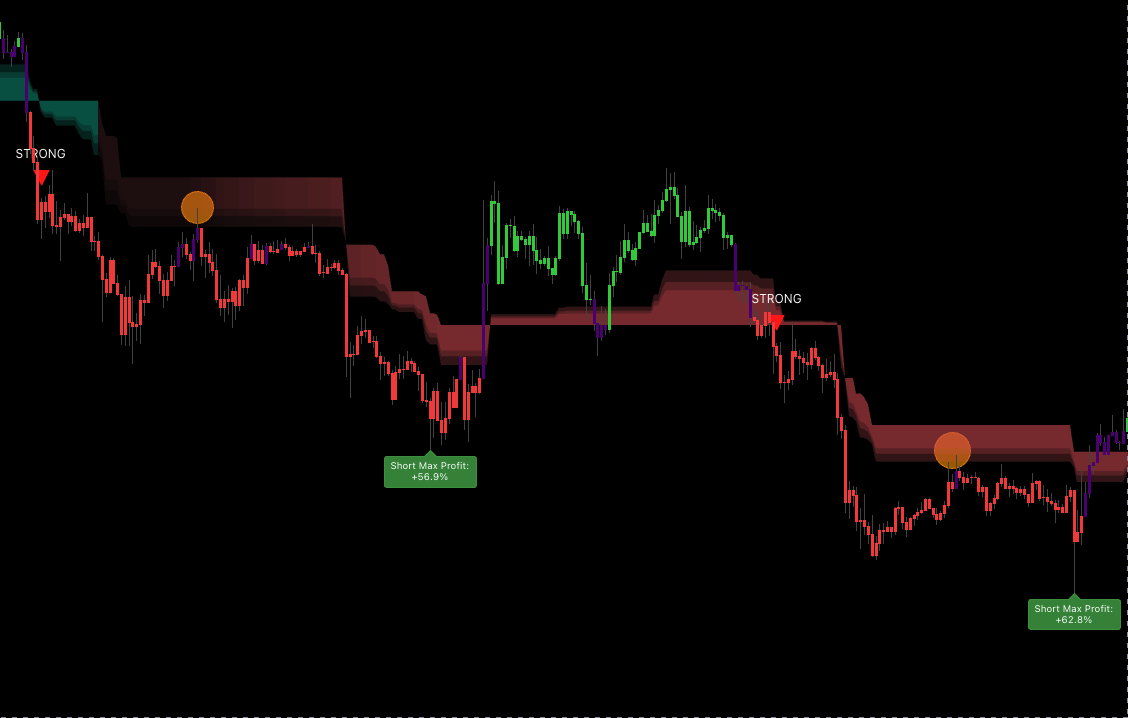
| Waves Trend Signals (STRONG ▲ / ▼) | Take only if cloud colour matches the triangle. Opposite → skip. |
| Contrarian Signals (▲ / ▼) | Take only when price has returned into the cloud in the same direction. |
| Advanced Signals (STRONG / NORMAL) | Same colour as cloud = full confidence; opposite = reduce size or skip. |
Key settings
The module is intentionally light on inputs — most behaviour is auto-tuned. The knobs that matter:
- Cloud layers — single layer (cleaner chart) vs three-layer Fibonacci (50% / 61.8% / 78.6%) acting as dynamic S/R. Multi-layer is recommended for swing and position; single-layer for scalp where chart density already runs hot.
- Smoothing — reduces flicker on the cloud-colour boundary. Higher smoothing means the cloud changes regime later, which is the conservative choice for swing traders.
Recommended setup
- Keep Trend Cloud enabled (it ships on by default).
- Also enable Trail Cloud for the medium-term confirmation.
- Enable RSI Band if you want the macro layer.
- Pick a Signals Detection mode that fits your strategy (Waves Trend / Contrarian / Advanced / DCA).
Three-box pre-trade checklist
- Trend Cloud matches your intended trade direction.
- Cloud is dense enough (not paper-thin) and has held its colour for at least 3 bars.
- Price is in the pullback area (not too far from the cloud, not piercing the floor).
3/3 → A-grade, full size. 2/3 → B-grade, half size. 1/3 → skip.
Trading playbook
Long — pullback into a green cloud
| Step | Action |
|---|---|
| Wait | Green cloud clearly dense for ≥ 3 bars. |
| Entry | Price pulls back into the cloud + a bullish trigger candle (engulf / pin / inside-break). |
| Aggressive entry | Limit order in the dense core; stop just below the cloud floor. |
| Stop | A few ticks below the cloud floor. Floor lost = trend dead. |
| TP 1 (1/3) | When price closes above the upper cloud edge — over-extension zone. |
| TP 2 (1/3) | Previous swing high or major resistance outside the cloud. |
| TP 3 (1/3) | Trail along the dense core — exit only on two consecutive closes below the core. |
Short — symmetrical inside a red cloud
Pullback into the cloud + bearish trigger, stop above the cloud ceiling, trail the core down, exit on two closes above.
Sizing by density
| Cloud density | Implied volume | Suggested size |
|---|---|---|
| Very dense | Strong | 100% |
| Medium dense | Normal | 75% |
| Slightly thin | Weak | 40% |
| Paper-thin / transparent | None | 0% — stand aside |
Volume-less symbols (some FX brokers, synthetic indices): density sits at a fixed level. In that case use cloud width instead — wider cloud = higher volatility = smaller size, wider stop.
Tips to improve outcomes
Read the cloud's breath
Watch the cloud expand and contract — that is the rhythm of the trend.
- Cloud narrowing → volatility dropping, breakout may be near → prepare entry.
- Cloud expanding → volatility rising, trend running → hold / trail.
- Cloud compressed for a while, then bursts → squeeze break, enter full size in the burst direction.
Pullback Stack — two clouds agreeing on the same entry
Rare but very strong: price pulls back simultaneously into the dense core of Trend Cloud and tags the middle of Trail Cloud, both the same colour. When two clouds confirm the pullback zone, R:R is typically very favourable.
Volume convergence
During the pullback, watch the cloud:
- The cloud is dense (strong volume during the main trend).
- A pullback occurs without the cloud thinning noticeably.
- → Pullback is healthy; trend likely to continue.
If the cloud thins clearly as price pulls back, the trend is losing power — be cautious.
Anchor Test — the trend's final exam
In healthy trends, price tends to do exactly one or two deep tests of the cloud floor before continuing. Signature:
- Deep pullback through the dense core, tags the floor.
- Bounces immediately with a rejection candle.
- Volume spikes; the cloud holds its colour.
This is the last-chance entry — the final add for the current trend cycle. The leg that follows tends to be the strongest part of the trend.
Multi-timeframe agreement
Run Trend Cloud on both the chart TF and a higher TF:
- Same colour → trend in phase, comfortable to enter.
- Different colours → divergence, scalp only, no holding.
- Higher TF flat (colour flips constantly) → market is ranging, skip trend trades, switch to Contrarian.
Avoid the fresh-flip trap
When the cloud just changes colour, wait at least 5 bars for confirmation before taking the first signal in the new direction. Trend Cloud is faster than the deeper layers and may flip a few times before settling.
Common mistakes
- Trading against cloud colour. The single largest source of avoidable losses. Red cloud = no longs, green cloud = no shorts, even if other signals say otherwise.
- Ignoring density. A paper-thin green cloud is a weak trend that flips easily. Wait for genuine density.
- Stop placed near the outer edge. The outer edge is a normal pullback zone and will be swept. Stops belong beyond the cloud floor.
- Hard R:R targets instead of trailing. Leaves trend money on the table. Trail with the core or floor for full moves.
- Disabling the cloud "to clean up the chart". You just removed your main bias filter. Trend Cloud has almost no inputs — keep it on.
- Entering during a transition. Colour unclear, thin, unstable → wait.
- Using Trend Cloud alone for long swings. It is fast and flips often on medium-term horizons. For long swings, always pair with RSI Band as the macro filter.
Common questions
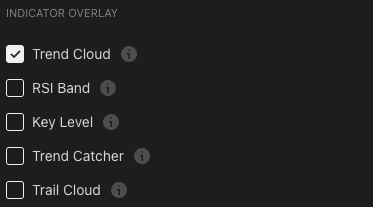
Q. Are there many inputs to tune? Almost none — just the on / off toggle in the indicator-overlay panel. All parameters are pre-tuned for stable behaviour across timeframes.
Q. Why does my cloud look paper-thin on this symbol? The symbol is in a low-volume phase. The cloud uses volume to modulate density — low volume → thin cloud → trend not confirmed. That is not a bug; it is the safety feature telling you to be cautious.
Q. What about volume-less symbols (FX, synthetic indices)? The cloud sits at a fixed density on those. Use cloud width instead — wider cloud = higher volatility = wider stop and smaller size.
Q. Why does Trend Cloud flip more often than Trail Cloud? By design. Trend Cloud hugs price for a fast bias; Trail Cloud is more heavily smoothed for a stable medium-term bias. Two clouds doing two different jobs — use both.
Q. On 1m the cloud flips constantly — I cannot trade off it. That is genuine lower-timeframe noise. Two options: move up to 5m / 15m, or use RSI Band as the main filter with Trend Cloud only as a trigger (enter only when both layers agree).
Where to go next
- Trail Cloud — medium-term confirmation layer that combines naturally with this module.
- RSI Band — macro bias layer; complete the three-cloud confluence.
- Waves Trend Signals — the entry engine that depends on Trend Cloud as its regime filter.
- Alerts — wire
Trend Cloud Directionalerts to push / webhook so you do not miss colour flips. - Overview — back to the study overview.