Chart types
The chart-type selector — Candlestick plus three Footprint modes (Bid×Ask, Delta, Volume) and the Tick · Heatmap mode. Which one fits which workflow, and how the price axis, right-click menu, and hover surfaces behave on each.
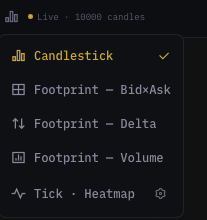
The chart-type selector sits next to the timeframe chip in the top toolbar. It swaps how price action is rendered without touching the underlying data — your indicators, drawings, and viewport position survive the switch. The menu offers 4 chart types: Candlestick and three Footprint modes (Bid×Ask, Delta, Volume), plus a separate Tick · Heatmap mode for streaming depth visualisation.
The 4 chart types
Candlestick
The default. Standard Japanese candlesticks — body, wicks, color-coded by direction. Use when you want the classic open / high / low / close read per bar.
- Body color: green = close ≥ open, red = close < open.
- Wicks: top wick = high, bottom wick = low.
- Colors and wick visibility are configurable in Chart settings.
Footprint — Bid×Ask
Each candle is split into price levels with bid-volume and ask-volume painted side-by-side as two columns inside the bar. Reveals exactly where buyers stacked vs. where sellers stacked at each tick price. Best for spotting absorption (one side eats the other's flow without price moving).
Footprint — Delta
Same split-by-price layout, but each level is painted with a single number = (ask volume − bid volume) plus a color tint. Reveals net aggressor pressure at each price. Best for spotting flips (positive delta turning negative inside the same candle = local exhaustion).
Footprint — Volume
Same split-by-price layout, painted with total traded volume per level, no bid/ask split. Reveals the volume profile inside each bar. Best for short-TF intraday work where you want a clean profile read without the bid/ask noise.
All three Footprint modes share one settings dialog. Click the cog icon next to "Footprint" in the chart-type menu (visible whenever a Footprint mode is the active selection) to open FootprintSettingsDialog. Stacked-imbalance detection, palette, font size, profile overlay — all live there.
Footprint usage notes
- Best at 1m / 3m / 5m. Above 15m the cells become too wide and read as noise — switch back to Candlestick.
- Indicators continue to paint over the Footprint cells (the cell grid is a candle-replacement, not a new pane).
- Drawings stay anchored to their original price coordinates.
Tick · Heatmap (separate mode)
Below the separator in the chart-type menu. Replaces candles with a tick-by-tick orderbook depth heatmap — bid / ask depth painted as a thermal-gradient column for every snapshot, normalised against the visible range. The strip updates on every depth message, so liquidity walls form and dissolve in real-time on screen.
- Streams live L2 depth from the
obAGfeed; the candle bridge pauses and a separateTickEnginemounts on the same canvas. - Heavy on bandwidth and GPU. Expect frame-rate drop on slow machines — drop indicators you don't need and keep to a single pane.
- Click the cog icon on the Tick · Heatmap row to open
TickBookmapSettingsDialog(palette, intensity curve, side-aware aggregation). - Pair with Walls and Whales in the side panel for the full order-flow read.
Switching types
Click the chart-type chip in the toolbar and pick. The chart re-renders immediately and:
- Indicators keep their state (no recompute).
- Drawings stay attached to their original price coordinates.
- The viewport stays where you had it.
- Footprint and Tick · Heatmap each have their own settings dialog opened from the menu's cog icon (see above).
Switching back to Candlestick from any of the other modes is always safe — none of them mutate the underlying OHLCV cache.
Price axis
The vertical axis on the right of each pane is the price axis. It anchors every price-driven element on the chart — candles, drawings, indicators, position lines.
Interactions
| Gesture | What it does |
|---|---|
| Drag the axis vertically | Pan the price range (move what's visible up or down). |
| Drag the axis horizontally | Compress / expand the price range — same time range, different vertical zoom. |
| Double-click the axis | Reset to auto-fit on the visible candles. |
| Scroll wheel on the axis | Zoom the price range around the cursor. |
The price-axis "+" menu
Hover the price axis at any point — a small + affordance appears next to the cursor. Click it (or right-click anywhere on the chart body) to open a trade/alert/draw menu anchored to the price under the cursor:
| Item | What it does |
|---|---|
| Trade @ Market | Open the trade dialog with Market order pre-filled. Uses the current best bid/ask. |
| Trade @ Limit | Open the trade dialog with Limit order pre-filled at the cursor price. |
| Add Alert at <price> | Open the alert dialog with the cursor price pre-set. |
| Draw horizontal line at <price> | Drop a horizontal line at the cursor price. Same as picking the horizontal-line tool from the left toolbar but skips the click-to-place step. |
The same menu is the right-click context menu on the chart body, plus three view-control rows at the bottom:
| Item | What it does | Shortcut |
|---|---|---|
| Hide / Show indicators | Toggle focus mode (hide all overlays for a clean read). | Double-click |
| Reset view | Restore both axes to the cold-load default (scroll back to latest, refit price). | — |
| Reset price scale | Refit the price range to visible candles. Keeps horizontal zoom. | R |
| Chart settings… | Open the global chart settings dialog. | — |
Hover tooltips
Move the cursor over the chart — the crosshair anchors to the candle under it and these surfaces appear:
- OHLC tooltip in the top-left of the pane — open, high, low, close, change %, volume for the hovered candle.
- Indicator values under the OHLC tooltip — each indicator's value at that bar.
- Footprint cell tooltip — when a Footprint mode is active, hover a cell to see bid volume, ask volume, delta, and imbalance status.
The legend visibility is configurable per overlay in Chart settings → Tooltips.
Common questions
Footprint cells look stretched at 15m+. Footprint is designed for 1m–5m. At higher TFs each cell becomes too wide and reads as noise. Switch to a lower TF or use Candlestick.
Tick · Heatmap drops my frame-rate. Tick · Heatmap renders every depth message. On slower machines:
- Keep to a single pane (no multi-pane while in Tick · Heatmap).
- Disable indicators you don't actively need.
- Lower the intensity / blur in
TickBookmapSettingsDialog.
The three Footprint variants share one settings dialog — that's intentional? Yes. Bid×Ask / Delta / Volume only differ in how each level is painted; the cell grid, the stacked-imbalance detector, the palette, and the profile overlay are shared. One dialog, three display modes.
Can I switch to Tick · Heatmap on a 1h timeframe? Yes, the timeframe doesn't change when you swap chart modes — but Tick · Heatmap is most useful at sub-minute timeframes where you can actually see the depth flicker bar-to-bar.
What's next
- Drawing tools — annotate any chart type.
- Indicator panel basics — stack overlays on top of your chosen chart type.
- Side panel — Orderbook, Walls, Whales — the order-flow companions to Tick · Heatmap and Footprint.