Level Zones & Bands
Anatomy of the mrD-RSI Premium panel — the 50 mid-line, the bull level 40-43 and bear level 57-60 (the primary pullback zones), overbought 80 / oversold 20, extreme bands 85-90 and 10-15, the EMA-9 fast line, the WMA-45 trend backbone, RSI candle coloring, the price-target lines, and the level-plus-signal combo grade table.
Signals are the leaves. Zones and bands are the trunk. Get this part right and you will read what the market is saying without waiting for an arrow to fire. The signal system in Signal System is built on top of the panel anatomy documented here; understanding the bands first makes every signal page click into place.
This page is the full reference for what each line, band, and zone on the RSI panel means — plus a combo-grade table at the end that tells you which signal + level combinations are A-setups versus C-setups.
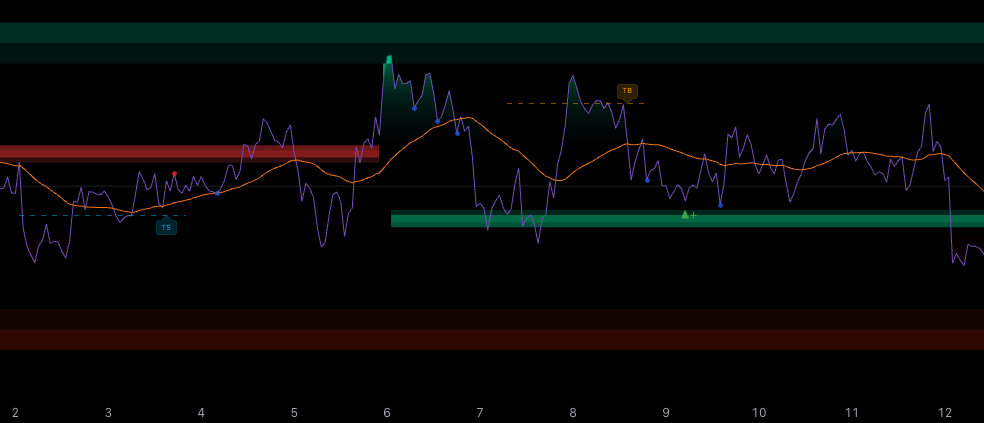 The full RSI panel layout. Each band has a specific meaning — the bull / bear levels are the primary pullback zones, the OB / OS bands are warnings, the extreme bands are the destruction zone, and the mid-line is the buyer / seller divider.
RSI panel map (top to bottom)
100 ────────────────────────  Ceiling
 90 ──────  Extreme overbought (rare)
 85 ──────
 80 ──────  Standard overbought
 60 ──────  ┐
 57 ──────  ┘  Bear level (resistance)
 50 ────────  Mid-line (equilibrium)
 43 ──────  ┐
 40 ──────  ┘  Bull level (support)
 20 ──────  Standard oversold
 15 ──────
 10 ──────  Extreme oversold (rare)
  0 ────────────────────────  Floor
1. The 50 mid-line — bull / bear divider
The most important horizontal line on the panel.
- RSI above 50 → buyers in control.
- RSI below 50 → sellers in control.
- RSI hovering 47–53 → indecision. Do not rush in.
Practical tip
- Only enter when RSI has clearly picked a side — at least 5–7 units away from 50.
- RSI crossing 50 upward with volume → bullish momentum shift.
- RSI crossing 50 downward with volume → bearish momentum shift.
The mid-line is also why the bull / bear level zones sit where they do — they are the "first significant value zone" just above (40–43) or just below (57–60) the divider, defining the cleanest pullback entries.
2. Bull level (40–43) — support zone
The "good" zone to buy in an uptrend.
When the zone fills green
- The indicator confirms the market is in a bullish phase.
- RSI just dipped to 40–43 = price is pulling back to value after a rally — potential buy opportunity.
When the zone is NOT filled (or barely tinted)
- The indicator did not detect a bullish phase → do not buy even if RSI sits at 40–43. The level is structural only when the regime confirms it.
Action
- Wait for ▲+ Pullback Buy or TS Trap Sell to fire inside this zone → high-quality entry.
- When a signal fires, the zone becomes a green 3D step shape — visual cue for instant recognition.
3. Bear level (57–60) — resistance zone
The "good" zone to sell in a downtrend.
When the zone fills red
- The indicator confirms a bearish phase.
- RSI just bounced to 57–60 = price is lifting to resistance after a drop — potential sell opportunity.
When the zone is NOT filled
- Do not sell just because RSI sits at 57–60. You need the red fill for bearish context — without it the level is structural noise.
Action
- Wait for ▼− Pullback Sell or TB Trap Buy to fire inside this zone → high-quality entry.
- When a signal fires, the zone becomes a red 3D step shape.
4. Overbought 80 / Oversold 20
A warning area — not an immediate entry zone.
RSI ≥ 80
- Market has "run too hot" upward → pullback probability is high.
- Do NOT short the top just because RSI > 80. In raging trends RSI can stay above 80 for dozens of bars.
- Correct play: wait for a pullback signal (▼− or SELL Hidden) after RSI exits 80.
RSI ≤ 20
- Market has "run too cold" downward → bounce probability is high.
- Do NOT buy the bottom just because RSI < 20. In a strong sell-off RSI can sit below 20 for many bars.
- Correct play: wait for a pullback signal (▲+ or BUY Hidden) after RSI exits 20.
Filled regions
- When RSI ≥ 80, the 80–100 band fills with deep green.
- When RSI ≤ 20, the 0–20 band fills with deep red.
- The deeper the fill, the deeper RSI is into the extreme.
5. Extreme bands 85/90 and 10/15
The "destruction zone" — only appears in vertical moves.
RSI hitting 85–90
- Extremely rare (a few times per year on the 1D timeframe of liquid majors).
- When it happens, a meaningful pullback in the next several days is almost guaranteed.
- Do not short immediately — wait for confirmation.
RSI hitting 10–15
- Sign of panic selling.
- Often a mid-term bottom.
- Do not catch the bottom immediately — wait for confirmation (BUY Hidden, ▲+).
Visual
- 85–90 and 10–15 are drawn with gradient steps to telegraph intensity.
- When RSI touches these, trim existing positions — do not get greedy. The reward-to-risk on continuation from here is poor.
6. EMA-9 (blue, optional) — fast line
The fast line on RSI.
Role
- Reacts quickly to RSI changes.
- Used as an internal trigger for pullback signals — already handled for you.
How to read it visually
- RSI crossing EMA-9 upward in oversold → short-term bullish momentum.
- RSI crossing EMA-9 downward in overbought → short-term bearish momentum.
When to enable it
- Scalpers who want to see ultra-short momentum on the panel.
- The indicator hides EMA-9 by default to keep the panel clean; enable in Settings → group indicator overlay.
7. WMA-45 (orange) — slow line — trend backbone
The single most important feature on the panel after RSI itself.
Role
- Acts as dynamic support for RSI in uptrends.
- Acts as dynamic resistance for RSI in downtrends.
Quick read
| State | Meaning |
|---|---|
| RSI above WMA-45 for many bars | Uptrend in motion. |
| RSI below WMA-45 for many bars | Downtrend in motion. |
| RSI touches WMA-45 then bounces | Healthy pullback → keep buying / selling in the direction. |
| RSI touches WMA-45 then pierces through | Possible trend reversal — careful. |
| RSI and WMA-45 tangled together | Sideways → stand aside. |
Tip
- The cleanest Pullback signal is when RSI pulls back to WMA-45 and bounces. This is the canonical setup the engine was tuned around.
- WMA-45 is on by default. Disabling it strips a critical filter from your visual read — strongly recommended to leave on.
8. The 3D step effect inside level zones
A visual cue, not a separate signal.
How it works
- When a Buy signal (▲+ or BUY Hidden) fires inside the Bull level (40–43): 3 stacked green boxes climbing up appear at that zone.
- When a Sell signal (▼− or SELL Hidden) fires inside the Bear level (57–60): 3 stacked red boxes falling down appear.
Reading the meaning
- Climbing steps = visualising upward push.
- Falling steps = visualising downward press.
- The most opaque layer hugs the level itself; the lighter layers are the signal's "breath".
Notes
- The effect only draws on the trigger bar — but you can see it linger in history for visual review.
- When too many old signals accumulate, the oldest steps may be removed to make room for new ones (Pine Script label limit). This is the same limit that affects historical signal visibility — see Signal System common questions.
9. Price-target lines (in the MTF table)
The MTF table has two final rows that project price targets:
- 80 ▲ — estimated price when chart RSI hits 80.
- 20 ▼ — estimated price when chart RSI hits 20.
How to use
- As a TP reference for counter-trend entries.
- As a profit-taking target for trend-aligned entries.
- Not a guarantee — these are estimates from current momentum and shift as price moves.
Full reference for the table itself: Multi-Timeframe — price-target lines.
10. Candle coloring
Bridges the RSI panel and the price chart so you do not have to glance twice.
Color legend
| Candle color | Meaning |
|---|---|
| Bright green | Strong bull — RSI > 50 + bullish state |
| Dark green | Weak bull — pullback in progress |
| Bright red | Strong bear — RSI < 50 + bearish state |
| Dark red | Weak bear — pullback in progress |
| Gradient | Neutral, RSI in mid-zone |
Practical tip
- Multiple bright green candles in a row = trend running → favour buy pullbacks.
- Multiple bright red candles in a row = trend running → favour sell pullbacks.
- Bright fading to dark → trend losing steam → reduce size.
Toggle
- On by default. Disable in Settings → group General settings → Candle Color.
11. The "level + signal" combo grade
The single most useful table on this page. Use it to grade every signal as it fires.
| Signal | Ideal level zone | Grade |
|---|---|---|
| ▲+ inside Bull level (40–43, green) | Yes | A — full size |
| ▲+ outside Bull level | No | B — half size |
| ▼− inside Bear level (57–60, red) | Yes | A — full size |
| ▼− outside Bear level | No | B — half size |
| TB inside Bear level + RSI near 60 | Yes | A — full trap |
| TS inside Bull level + RSI near 40 | Yes | A — full trap |
| Any signal while RSI is at 80+ or 20− | — | C — too extreme, stand aside |
The C-grade row is the most overlooked rule: a Pullback signal that fires while RSI is already at 80+ or 20− is almost always a late signal — the move is mostly done. Skip those even when the arrow looks clean.
Where to go next
- The seven signal types this panel anatomy supports: Signal System.
- The MTF table that adds cross-timeframe context to every level read: Multi-Timeframe.
- Wire the signals fired at these levels into push / webhook: Alerts.
- Back to the study overview: mrD-RSI Premium.