Contrarian Signals
Contrarian Signals is the reversal-hunting module inside mrD-Signals Premium — fires only when a multi-timeframe ATR composite (15m + 30m + 1H + 1D + chart) agrees on trend exhaustion AND a volatility burst confirms real liquidity. Full settings reference, the mandatory Trail Cloud pairing, and the playbook for the F1 / F2 / F3 pullback bands.
Contrarian Signals is the reversal-hunting module inside mrD-Signals Premium. Where Waves Trend catches the start of a new trend wave and rides it, Contrarian fires when an existing trend is exhausting and a fresh move in the opposite direction is confirmed by both multi-timeframe agreement and a volatility expansion.
This is not "early entry" or top / bottom picking — Contrarian only prints once the market has already turned. The job of the filter stack is to keep you out of the false reversals that plague single-timeframe counter-trend indicators.
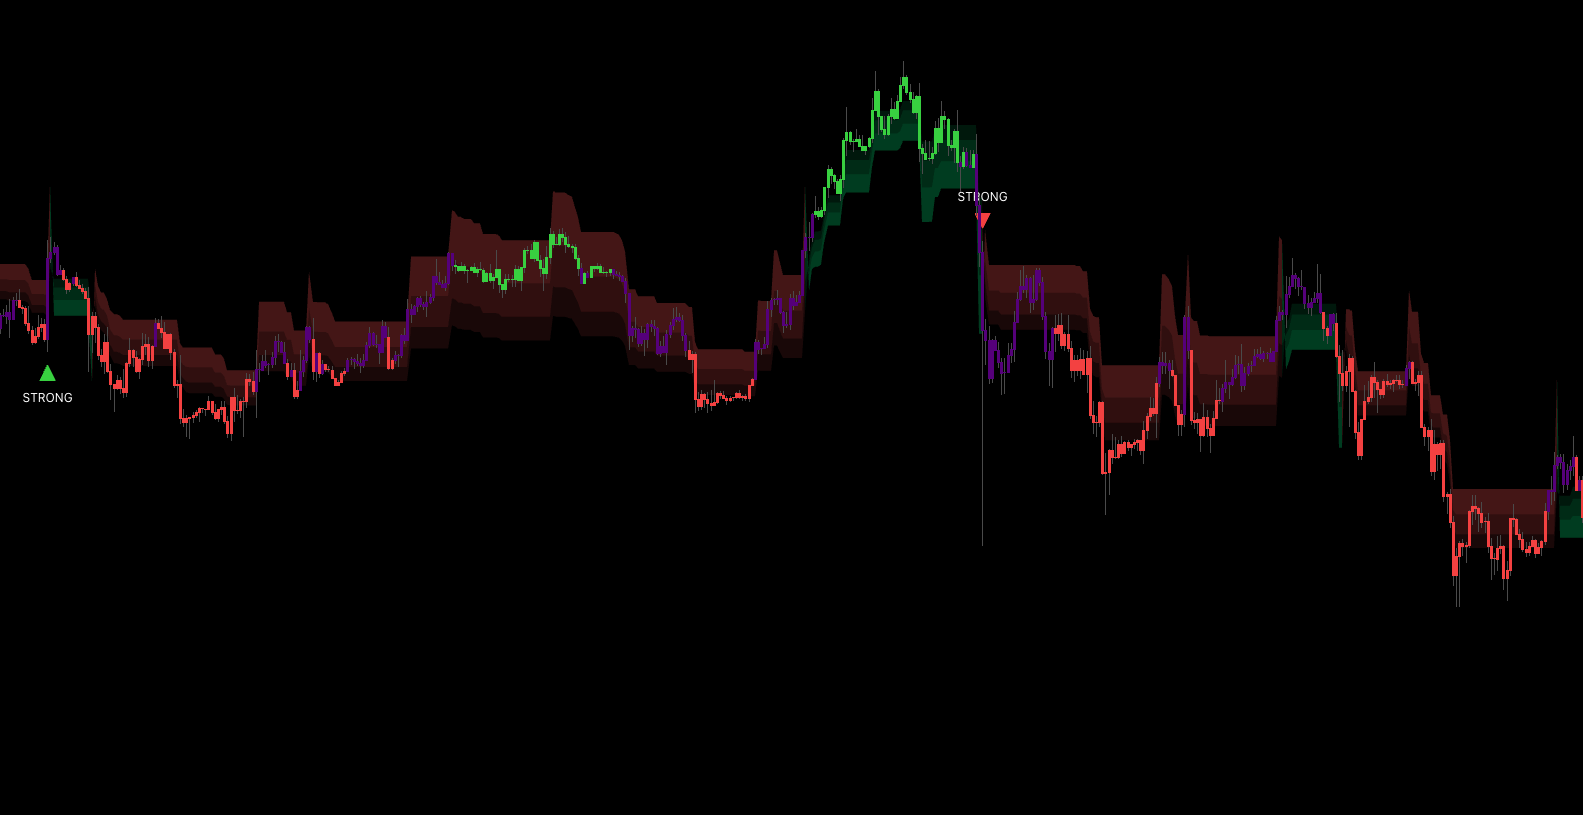
 A BUY ▲ printed at the bottom of an extended downtrend after five timeframes agreed on exhaustion and the volatility threshold confirmed real liquidity stepping in.
What this module does
A Contrarian triangle prints only when both conditions are met on the same bar:
- Multi-timeframe trend agreement — several timeframes (chart + 15m, 30m, 1H, 1D) read the old trend as reversing. Not just the chart you are looking at; the consensus across the stack.
- Volatility burst — a sudden expansion of true range above the ATR threshold, signalling real liquidity (not normal drift).
The double-filter is what makes Contrarian rare but high-conviction. Single-timeframe reversal indicators print constantly against an established trend; this one waits for the multi-TF read AND a volatility confirmation before signalling.
Bar coloring — the regime read
Every bar is tinted by a composite regime score combining EMA50, EMA200, RSI(14) and support / resistance position:
- Green bar — bullish composite AND price is holding above support.
- Red bar — bearish composite AND price is below resistance.
- Neutral / grey bar — no clear regime → stay out.
Bar colour is the running regime read; the triangle is the entry trigger inside that regime.
Fixed parameters — there is no profile selector
This module uses fixed reference parameters matching the original MTF ATR Reversal Levels indicator (DeuceDavis / Blackflag FTS lineage). The Signals Swing dropdown that controls Waves Trend has no effect on Contrarian — only on Waves Trend.
| Parameter | Value | Notes |
|---|---|---|
| ATR Period (Wilder MA) | 28 | Reference default |
| ATR Factor (trail width) | 3.0 | Reference default |
| TR/ATR Threshold (volatility gate) | 1.0 | Reference default |
| Trail Type | modified | Reference default |
| Internal timeframes | Chart TF + 15m + 30m + 1H + 1D | Reference default |
| Bar EMA fast / slow | 50 / 200 | — |
| Bar Lookback H/L | 80 | — |
| Bar Score Threshold | 0.5 | — |
Contrarian behaves identically on every chart, every asset, every session — it is the original reference logic, period. The only thing you control is the chart timeframe you trade on.
Recommended chart timeframe. 5m to 4H. The internal timeframes are 15m / 30m / 1H / 1D plus the chart, so above 1D the lower TFs lose meaning and below 1m the cloud and signals will lag.
Why this module must be paired with Trail Cloud
Trading Contrarian naked is a trap. Contrarian gives you the WHEN of a reversal; Trail Cloud gives you the WHERE to anchor stops and the WHY the reversal is still valid.
 Trail Cloud paints F1, F2, F3 pullback bands plus the trail line. Contrarian triangles printed inside or near F1 / F2 are the high-conviction entries.
What Trail Cloud adds
- Volatility margin — price has to break the trail line by an extra margin before the regime can flip. Filters the noise.
- Multi-bar confirmation — the opposite direction must persist for several consecutive bars before the cloud actually changes colour.
- Three internal pullback bands — F1 (shallow pullback), F2 (standard pullback), F3 (deep pullback) divide the distance between the trail line and the recent extreme into standard pullback zones.
How they combine
| Trail Cloud state | BUY ▲ Contrarian means... | SELL ▼ Contrarian means... |
|---|---|---|
| Lime / uptrend | Pullback into demand — A-grade long | Counter-trend — skip or scalp only |
| Red / downtrend | Counter-trend — skip or scalp only | Pullback into supply — A-grade short |
| Just flipped (transition) | Wait 3–5 bars for the cloud to settle | Wait 3–5 bars for the cloud to settle |
In short: Trail Cloud is the regime filter; Contrarian is the entry trigger inside that regime. The three pullback bands then give you exact zones to enter, place stops, and scale out of.
Recommended baseline setup
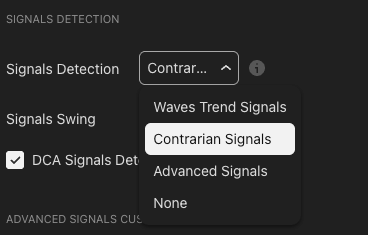
- Enable Trail Cloud as an overlay.
- Set Signals Detection to
Contrarian Signals. - Leave the Signals Swing dropdown alone — it has no effect on Contrarian.
- Optional — enable DCA Signals Detection for additional confluence.
- Set the chart timeframe somewhere in the 5m – 4H window.
Pre-trade checklist
- Trail Cloud is lime (long) or red (short).
- The cloud has held the same colour for at least 5 bars (no fresh flip).
- The Contrarian triangle prints in the same direction as the cloud.
- The signal bar colour matches the triangle (green bar with ▲, red bar with ▼).
Four out of four = A-grade. Three of four = B-grade (half size). Two or below = skip.
Trading playbook
The patterns below are starting templates — adapt to your own risk model.
Long — BUY ▲ inside a lime Trail Cloud
| Step | Action |
|---|---|
| Entry | Market on signal close, or limit at the Trail Cloud's F1 band (shallow pullback) — whichever fills first. |
| Stop | A few ticks below the Trail Cloud line (the lowest band). If broken, the regime likely flipped — exit. |
| TP 1 (1/3) | Previous swing high, or the recent extreme used by Trail Cloud as reference. |
| TP 2 (1/3) | Trail with the F2 band. Exit if price closes below it. |
| TP 3 (1/3) | Trail with the Trail Cloud line itself. Exit only when the cloud flips red and confirms. |
Short — SELL ▼ inside a red Trail Cloud
Symmetrical: entry at market or limit at F1, stop above the trail line, trails follow F2 then the trail line up, exit on a confirmed cloud flip to lime.
Position sizing
- A-grade (4/4 checks) — full size.
- B-grade (3/4 checks) — half size.
- Counter-trend (triangle against cloud) — zero size, do not enter.
Tips to improve signal quality
Pullback-band confluence
The strongest setups happen when the Contrarian triangle prints inside or just past an F1 / F2 pullback band. That means price just tagged a high-probability pullback zone and the multi-timeframe reversal logic agrees on the same bar.
Rule of thumb: take the trade only if the signal bar's wick or close is within the cloud fill area (between trail line and F2). Skip signals that fire deep outside the cloud — they are too late.
Avoid the fresh-flip trap
The very first signal after Trail Cloud changes colour is often a whipsaw. Wait at least 5 bars after the flip before taking the next Contrarian signal in the new direction.
Cross-check higher-timeframe agreement
Open a higher TF chart (trading 15m → also check 1H). Take the signal only if the higher-TF Trail Cloud is the same colour. This single rule removes the worst losing trades from a Contrarian workflow.
Volume and event awareness
Contrarian signals during news spikes or low-liquidity sessions (early Asia for FX, weekends for crypto) are unreliable — the volatility threshold can fire on a news wick that does not follow through. Defer to the cloud read; skip aggressive entries around scheduled events.
Do not fight clusters of opposite signals
If the previous one or two Contrarian triangles in the same direction failed (price did not reach TP1), the regime is unclear. Wait for the Trail Cloud to flip first, then take the next signal in the new direction.
Adapt your chart timeframe, not the indicator
Since Contrarian uses fixed parameters, the only knob you have is the chart timeframe:
- Quiet, ranging market → drop to a lower chart TF (1H → 15m) for more signals per session.
- High-volatility, trending market → step up to a higher chart TF (15m → 1H) so the five internal TFs cover a wider window and filter noise.
Common mistakes
- Taking a triangle against the cloud colour. The single largest source of avoidable losing trades. Confirm cloud first.
- Ignoring neutral bars. Neutral means no regime — skip.
- Stop placed too tight. Contrarian fires after a strong move, so the very next bar can range wide. Place the stop beyond the trail line, not at the signal candle's low / high.
- Trying to tune Contrarian via the Signals Swing dropdown. It does nothing for Contrarian — that dropdown only affects Waves Trend.
- Disabling Trail Cloud "to see signals better". You just removed the single most important confirmation.
- Averaging down on a failing Contrarian trade. These are reversal signals — if it did not work in the first 3–5 bars, the reversal failed. Cut the loss.
Where to go next
- Trail Cloud — the mandatory pairing for this module.
- Waves Trend Signals — the trend-following companion; runs well on the same chart as Contrarian.
- Statistics Dashboard — read the historical Contrarian win rate on the current symbol before committing size.
- Alerts — fire push / webhook on each reversal triangle.
- Overview — back to the study overview.