Info Table
Info Table inside mrD-RSI Pullback — the 12-row live trading dashboard in the chart corner that lets you decide in five seconds. Full reference for the seven-cell Trend Status arrow (3 to -3), price / RSI / Trend / ATR / Vol Ratio / Mom / EMA-200 / Swing H/L / D High/Low / Signals mode rows, the position selector (Top Right / Bottom Right), the 5-second pre-trade workflow, the "three kings" cloud + EMA-200 + Trend combo, and position-sizing tips.
The Info Table is the decision-support dashboard of mrD-RSI Pullback. It is a 12-row live data strip pinned in the chart corner that lets you read trend, RSI, ATR, volume, EMA-200, swing levels, and the previous day's high / low in five seconds — without flipping panels or running side calculations.
This page is the complete reference for the Info Table module. Every signal you take should pass through the 5-second pre-trade workflow described below before you click buy or sell.
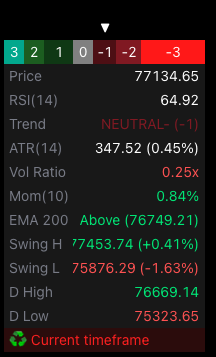 The full 12-row dashboard. The top row is the Trend Status colour strip with an arrow pointing at the current cell; the rest are live values that update every tick (except daily levels).
1. What is in the Info Table?
The dashboard shows 12 main rows of data, including:
| Row | Content | Meaning |
|---|---|---|
| Trend Status row | 7-cell colour strip + ▼ arrow | Current trend state (3 → -3) |
| Price | Last close | Real-time price tracking |
| RSI(14) | RSI value | Red if > 70, green if < 30 |
| Trend | State description | STRONG BULL / WEAK BULL / NEUTRAL / WEAK BEAR / STRONG BEAR |
| ATR(14) | Average True Range + % | Current volatility |
| Vol Ratio | Current volume / SMA20 | Market "activity" level |
| Mom(10) | Rate of Change 10 bars | Trend speed |
| EMA 200 | Above / Below | Long-term trend bias |
| Swing H | 20-bar swing high + % | Nearby resistance |
| Swing L | 20-bar swing low + % | Nearby support |
| D High | Previous day high | Daily TF resistance |
| D Low | Previous day low | Daily TF support |
| Signals mode | TF warning | "Go to {TF}" if wrong chart TF |
2. Enable and choose position
Open Settings → group Display → Info Table
| Option | Position |
|---|---|
| None | Off |
| Top Right | Top-right corner |
| Bottom Right | Bottom-right corner (default) |
Recommendation: Bottom Right so it does not obscure price action above.
3. Reading each row
Trend Status row (top — 7 coloured cells)
A strip of 7 cells from deep green → light green → grey → light red → deep red, representing 7 trend levels:
| Cell | Code | Description |
|---|---|---|
| 1 (deepest green) | 3 | Strong Bull (strong RSI + bullish state) |
| 2 | 2 | Weak Bull |
| 3 | 1 | Neutral from Bullish (much weaker) |
| 4 (grey) | 0 | Fully neutral |
| 5 | -1 | Neutral from Bearish |
| 6 | -2 | Weak Bear |
| 7 (deepest red) | -3 | Strong Bear |
A ▼ arrow points to the cell matching the current state → you instantly see where the trend stands.
Price
Last close. Updates live.
RSI(14)
- Red if > 70 (overbought) → top warning.
- Green if < 30 (oversold) → bottom warning.
- White if 30–70.
Trend
Detailed text:
- STRONG BULL (3) — bright green.
- WEAK BULL (2) — dark green.
- NEUTRAL+ (1) — light green.
- NEUTRAL (0) — grey.
- NEUTRAL- (-1) — light red.
- WEAK BEAR (-2) — dark red.
- STRONG BEAR (-3) — bright red.
ATR(14)
Average True Range + % of price. Used to calculate SL distance:
- High ATR = high volatility → wider SL → smaller size.
- Low ATR = low volatility → tighter SL → larger size.
1.5×ATR rule: SL should be at least 1.5×ATR away to avoid stop hunts.
Vol Ratio
Current volume / 20-bar average volume.
| Vol Ratio | State |
|---|---|
| > 1.5 | Volume burst — strong trend confirmation |
| 1.0 – 1.5 | Normal volume |
| 0.5 – 1.0 | Weak volume — trade cautiously |
| < 0.5 | Volume drying up — stand aside |
Mom(10)
Rate of Change over 10 bars (%). Measures how fast price is moving.
- Green if > 0 (rising).
- Red if < 0 (falling).
EMA 200
Price position vs EMA 200:
- Above (green) = price above EMA 200 → long-term LONG bias.
- Below (red) = price below EMA 200 → long-term SHORT bias.
→ Golden rule: only trade in EMA 200's bias direction → massive win-rate boost.
Swing H / Swing L
Highest / lowest in the last 20 bars + % distance.
Use:
- Near TP target (Swing H for longs, Swing L for shorts).
- Short-term resistance / support.
D High / D Low
Previous day's high / low (Daily TF).
Use:
- Critical intraday resistance / support.
- Day-traders watch for breakouts through D High / D Low.
Signals mode (last row)
Shows current signal mode:
- "Current timeframe" = standard Pullback.
- "15m & 1h", "1h & 4h" etc. = Advanced mode.
- Go to {TF} to Display Signals = wrong chart TF for the chosen mode (see Advanced Pullback).
4. Eight tips for using the Info Table effectively
Tip 1 — The 5-second workflow
Before entering, read in this order:
- Trend Status row — what level is trend at?
- EMA 200 — trading with main bias?
- Vol Ratio — enough volume?
- ATR — how wide should SL be?
- Swing H/L — where to place TP?
Read these 5 cells in 5 seconds, decide trade or not.
Tip 2 — Filter "Vol Ratio ≥ 0.8x"
This is a hard filter for every entry. Vol < 0.8× = weak market, easy stop hunt.
Tip 3 — The "three kings" combo: EMA 200 + Cloud + Trend
| EMA 200 | Cloud | Trend score | Action |
|---|---|---|---|
| Above | Green | +2 / +3 | High-conviction BUY signal |
| Above | Green | 0 / -1 | Caution — trend weakening |
| Below | Red | -2 / -3 | High-conviction SELL signal |
| Below | Red | 0 / +1 | Caution — trend weakening |
| Above | Red | any | Conflict — stand aside |
| Below | Green | any | Conflict — stand aside |
Tip 4 — High ATR = no scalping
When ATR % > 2% (crypto) or > 0.5% (forex), market is in extreme volatility. Scalping 1m–5m will be noisy. Switch to higher TF.
Tip 5 — Vol Ratio spike = direction change
Vol Ratio suddenly > 3.0× with a large bar → news / institutional move. Consider closing current trade + waiting for new context.
Tip 6 — D High / Low are "magnets"
Intraday, price tends to gravitate toward D High or D Low. If price near D High + green cloud → may reach (long). Just broke D High with volume → continues.
Tip 7 — "Go to {TF}" warning — do not ignore
If you see the red row "Go to 1h to Display Signals" → no Pullback signal will fire on the current chart. Switch TF immediately or change mode. Full reference: Advanced Pullback.
Tip 8 — Mom changing fast = trend reversal
If Mom was +5%, suddenly drops to -2% in a few bars → momentum reversed fast → reduce exposure.
5. Three real-world use cases
Use case 1 — Pre-session trade scan (3 min / asset)
- Open asset chart, check Info Table:
- Trend Status: STRONG BULL (3) — green light.
- EMA 200: Above — green light.
- Vol Ratio: 1.2× — green light.
- ATR %: 0.8% — green light (moderate).
- → This asset is worth watching, prepare entry.
Use case 2 — Position sizing decision
| Vol Ratio | Trend | Size |
|---|---|---|
| > 1.5 | STRONG BULL / BEAR | 100% size |
| 1.0–1.5 | STRONG | 75% size |
| 0.8–1.0 | WEAK | 50% size |
| < 0.8 | any | Skip |
Use case 3 — SL & position size calculation
Account $10,000, 1% risk = $100 / trade.
ATR is $200 (crypto BTC).
→ SL distance = 1.5×ATR = $300 → Position size = $100 / $300 = 0.33 BTC contract.
(Pseudo math — exact calc depends on leverage and contract size.)
6. Common mistakes
| Mistake | Fix |
|---|---|
| Skipping Info Table, only looking at signals | Info Table provides mandatory context. |
| Trading with EMA200 vs Cloud conflict | Stand aside, wait for confluence. |
| Setting SL without ATR consideration | Random SL = stop hunt. |
| Trading with Vol Ratio < 0.5× | Skip — volume drying. |
| Ignoring "Go to {TF}" warning | No signals will fire — change TF. |
Common questions
Table is too big and obscures the chart — what do I do? Change Text Size to Tiny in settings. Or move position to Top Right if price action is usually below.
Why does Trend Status sometimes match the cloud, sometimes not? Cloud (RSI Band) and Trend Status (RSI state) are different logics:
- Cloud: based on price-source Supertrend.
- Trend Status: based on RSI crossing thresholds (33 / 67).
95% of cases they match. 5% diverge when RSI and price are out of phase (like Hidden Divergence).
Tooltip on each cell? Yes, hover the Trend Status row's colour cells to see detail tooltips.
Is the table real-time? Yes, updates every tick (except daily values like D High / Low).
Final thought
Five seconds of Info Table = five years of experience. Read slow, enter fast.
The Info Table is the layer most traders ignore — and it is the single most underrated decision-aid the study ships with. Run the 5-second workflow on every signal. Skip it and you trade blind.
Where to go next
- The core entry engine the table provides context for: Pullback Signals.
- The multi-TF "Go to {TF}" warning the table surfaces: Advanced Pullback.
- The S/R Volume Zones the table's Swing H/L rows complement: S/R Volume Zones.
- The 12 golden rules for max win rate: Winrate Tips.
- Back to the study overview: mrD-RSI Pullback.