Indicator panel basics
How to add, enable, focus, and configure indicators on the chart. The indicator panel strip, the catalog dialog, per-indicator settings cog, lock states, and the difference between catalog plans.
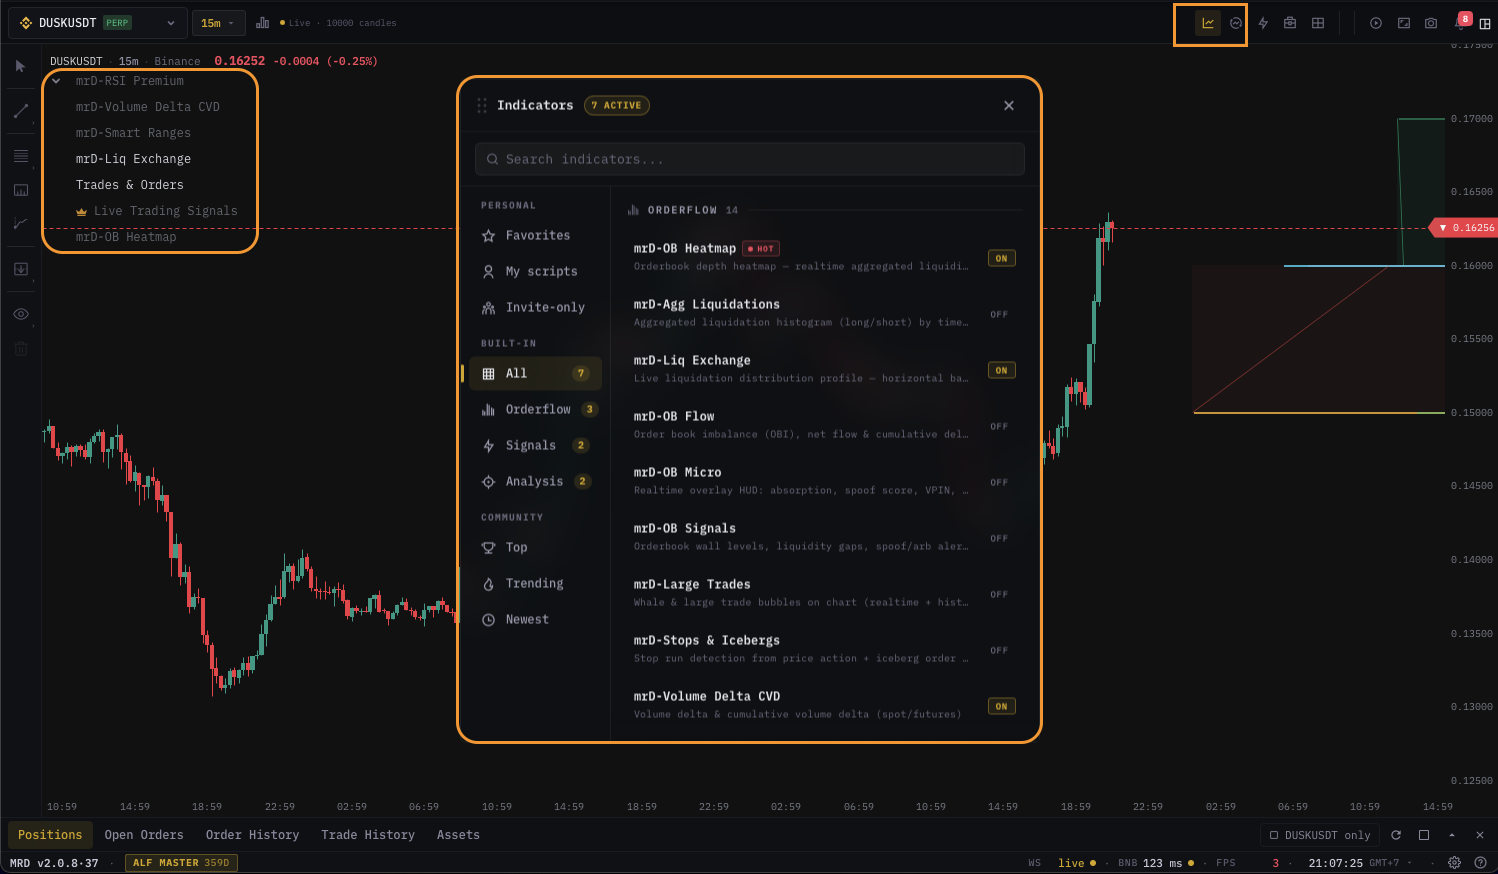
The indicator panel is the strip above the chart canvas where every active indicator gets a row with its name, a one-line summary, a focus toggle, and a settings cog. The catalog dialog (opened from the Indicators button in the top toolbar) lists every available indicator, separates them by family, and surfaces plan locks for premium engines. This page covers the panel UX; for the full catalog of indicators and their settings, see Chart Indicators catalog.
The indicator panel strip
Every indicator you enable adds a row to the panel above the chart. Each row carries:
| Element | Purpose |
|---|---|
| Icon | Compact identity for the indicator family (RSI, EMA, CVD, heatmap, ...). |
| Name | Indicator display name. Premium indicators show a small Pro chip. |
| Live summary | One-line summary that updates per tick — current value, divergence flag, RSI bucket, ... |
| Focus toggle | Hides every other indicator's overlay so only this one paints on the chart. |
| Mute alerts | Suppresses the alert sound for this indicator without disabling alerts. |
| Settings cog | Opens the per-indicator settings dialog. |
| Eye toggle | Hides the visual without removing the indicator from the panel. |
| Delete | Removes the indicator from the chart (and its alerts on this chart). |
Indicator rows are draggable — reorder them to control overlay paint order (top of list = drawn last = on top).
The catalog dialog
Click Indicators in the top toolbar (or press I) to open the catalog. The catalog is grouped by family:
- Price action — EMA, VWAP, VRVP, S/R levels.
- Momentum & oscillators — RSI, MACD, Stochastic, mrD-RSI Premium, mrD-RSI Pullback.
- Volume & order flow — Volume, CVD, CVD Profile, OI, Funding, Large Trades, Footprint helpers.
- Liquidity & heatmap — Order-book heatmap, Liquidation heatmap, AGG-liq, walls, VPIN.
- Smart-money & signals — mrD-Smart Ranges, mrD-Signals Premium, AI Live Signals, OI-CVD Pattern, mrD-Pullback.
- Custom — your DeltaDSL scripts and any catalog imports.
Each catalog card shows:
- A thumbnail / mini preview.
- A short tagline.
- A plan badge — Free / Basic / Premium / Master / Ultimate.
- An Enable button.
Premium indicators that exceed your plan are shown but marked with a lock — clicking lock opens the plan-upgrade snackbar with a deep link to billings.
Search & filter
The top of the dialog has a search input and family filters. Search is substring across name + tagline. Filters multiply with search — volume + family Order flow narrows the list.
Adding to the chart
Click Enable on a card. The indicator drops onto the chart and appears in the panel strip. Default settings are used; click the cog on the panel row to fine-tune.
Per-indicator settings
Click the cog on any panel row to open the indicator's settings dialog. Every indicator has its own dialog with its own controls; the shape is shared:
- Inputs — parameters (lookback periods, thresholds, multipliers).
- Style — colors, line widths, fill, marker shapes.
- Display — show/hide sub-features, label placement, panel vs. overlay.
- Alerts — arm alerts directly from the dialog (alternative to the global alerts dialog).
- Presets — load / save user presets per indicator.
Settings persist per pane. Two panes with the same indicator can have different settings — useful for comparing 14-period RSI on one pane with 21-period on another.
For the full per-indicator dialog reference, see the indicator catalog.
Focus mode
Focus is a one-tap "show only this" filter. Click the focus icon on an indicator's row and the chart hides every other overlay (other indicators, drawings stay; chart elements like position lines stay). Click focus again to release. Useful when stacking 6+ indicators and you want to read one clearly.
Only one indicator can be focused at a time. Focusing a second indicator releases the first.
Eye toggle vs. delete vs. mute
| Action | What happens |
|---|---|
| Eye toggle | Visual overlay hides but indicator keeps computing, keeps firing alerts. Use when you want the alert without the chart clutter. |
| Mute alerts | Alerts no longer beep / push for this indicator; overlay still paints. Use during meetings. |
| Delete | Removes the indicator from the panel. Its alerts stay armed in the alerts inbox unless you delete those separately. |
Plan locks
Indicators are locked by plan tier. The current tiers are:
- Free — basic RSI, EMA, Volume.
- Basic — adds VWAP, CVD, basic VRVP.
- Premium — adds mrD-RSI Premium, mrD-Smart Ranges, mrD-Signals Premium.
- Master — adds mrD-RSI Pullback, AI Live Signals, advanced heatmap modes.
- Ultimate — adds full DeltaDSL custom scripts, multi-account streaming.
If you enable an indicator whose required tier exceeds your current plan, the chart shows the indicator name + a lock badge instead of the overlay. A snackbar surfaces with an Upgrade link to /others/profile?tab=billings. The terminal will not silently disable a feature mid-session — you stay informed.
For the canonical plan check, see Plan tiers & features.
Per-chart presets
The indicator stack — what is enabled, settings, paint order — can be saved as a per-chart preset from the layout selector. Saved presets appear under Per-chart layouts in the layout panel.
Useful presets:
- Order flow — Heatmap + CVD Profile + VRVP + Large Trades + Walls.
- Pullback hunter — mrD-RSI Pullback + EMA cloud + S/R zones + Volume + Footprint helpers.
- Trend rider — mrD-Smart Ranges + EMA stack + ADX + VWAP.
Save once; apply from any pane.
Performance considerations
Every active indicator runs against every tick. Stacking 8+ heavy indicators (heatmap-based, profile-based, custom scripts) on a sub-minute TF will drop your frame-rate on older machines. If the chart feels sluggish:
- Disable indicators you're not actively reading (use the eye toggle, not delete, if you want them back).
- Reduce the heatmap sensitivity in the indicator settings.
- Disable footprint helpers when you're not in Footprint chart mode.
There is no per-indicator CPU meter in the panel; trust your frame-rate.
Common questions
I added an indicator but it doesn't appear on the chart. The indicator might be a panel-style indicator (e.g. RSI, MACD) that paints below the chart as a sub-panel — scroll the chart pane to find it. The panel-vs-overlay setting is in each indicator's settings dialog under Display.
Settings I change in one pane affect the other pane. Settings are per-pane by default but some indicators have Global settings baked in (e.g. heatmap color preset). Check the indicator's dialog — if a setting has a globe icon, it's global.
The catalog shows "0 indicators" matching my search. Your search may have crossed family filters. Click the All families chip to clear filters.
Premium indicators show but won't enable. Your plan doesn't include them. The Enable button is replaced with Upgrade — clicking opens the upgrade snackbar. See Plan tiers & features.
What's next
- Chart Indicators catalog — the full per-indicator reference (23 pages).
- Quick trade & floating bar — trade off an indicator signal without leaving the chart.
- Trading alerts — arm cross-indicator alerts.